Choosing a Gaming CPU at 1440p: Adding in Haswell
by Ian Cutress on June 4, 2013 10:00 AM EST
A few weeks ago we released our first set of results to aid readers in deciding what CPU they may want for a new single or multi-GPU build. Today we add in some results for the top end Haswell CPU, the i7-4770K.
As you may have gathered from our initial Haswell coverage, we have had access to the processors for a couple of weeks now, and in that time we have had the opportunity to run through our gaming CPU tests as far as the motherboards we have had access to allows. We have had a variety of PCIe combinations (up to x8/x4/x4 including x8/x8+x1 and x8/x8+x4) worth testing to make sure you aim for the multi-GPU motherboard that fits best. We have also had a small amount of time to test a few more CPUs (Q9400, E6550) to fill out the roster a little.
This Update
In order to keep consistency, I want to this article to contain all the information we had in the previous article rather than just reference back – I personally find the measure of applying statistics to the data we obtain (and how we obtain it) very important. The new CPUs will be highlighted, and any adjustments to our conclusions will also be published. I also want to answer some of the questions raised from our last Gaming CPU article.
Where to Begin?
One question when building or upgrading a gaming system is of which CPU to choose - does it matter if I have a quad core from Intel, or a quad module from AMD? Perhaps something simpler will do the trick, and I can spend the difference on the GPU. What if you are running a multi-GPU setup, does the CPU have a bigger effect? This was the question I set out to help answer.
A few things before we start:
This set of results is a work in progress. For the sake of expediency I could not select 10 different gaming titles across a variety of engines and then test them in seven or more different configurations per game and per CPU, nor could I test every different CPU made. As a result, on the gaming side, I limited myself to one resolution, one set of settings, and four very regular testing titles that offer time demos: Metro2033, Dirt 3, Civilization V and Sleeping Dogs. This is obviously not Skyrim, Battlefield 3, Crysis 3 or Far Cry 3, which may be more relevant in your set up. The arguments for and against time demo testing as well as the arguments for taking FRAPs values of sequences are well documented (time demos might not be representative vs. consistency and realism of FRAPsing a repeated run across a field), however all of our tests can be run on home systems to get a feel for how a system performs. Below is a discussion regarding AI, one of the common usages for a CPU in a game, and how it affects the system. Out of our benchmarks, Dirt3 plays a game, including AI in the result, and the turn-based Civilization V has no concern for direct AI except for time between turns.
All this combines in with my unique position as the motherboard senior editor here at AnandTech – the position gives me access to a wide variety of motherboard chipsets, lane allocations and a fair number of CPUs. GPUs are not necessarily in a large supply in my side of the reviewing area, but both ASUS and ECS have provided my test beds with HD7970s and GTX580s respectively, such that they have been quintessential in being part of my test bed for 12 and 21 months. The task set before me in this review would be almost a career in itself if we were to expand to more GPUs and more multi-GPU setups. Thus testing up to 4x 7970 and up to 2x GTX 580 is a more than reasonable place to start.
Where It All Began
The most important point to note is how this set of results came to pass. Several months ago I came across a few sets of testing by other review websites that floored me – simple CPU comparison tests for gaming which were spreading like wildfire among the forums, and some results contradicted the general prevailing opinion on the topic. These results were pulling all sorts of lurking forum users out of the woodwork to have an opinion, and being the well-adjusted scientist I am, I set forth to confirm the results were, at least in part, valid. What came next was a shock – some had no real explanation of the hardware setups. While the basic overview of hardware was supplied, there was no run down of settings used, and no attempt to justify the findings which had obviously caused quite a stir. Needless to say, I felt stunned that the lack of verbose testing, as well as both the results and a lot of the conversation, particularly from avid fans of Team Blue and Team Red, that followed. I planned to right this wrong the best way I know how – with science!
The other reason for pulling together the results in this article is perhaps the one I originally started with – the need to update drivers every so often. Since Ivy Bridge release, I have been using Catalyst 12.3 and GeForce 296.10 WHQL on my test beds. This causes problems – older drivers are not optimized, readers sometimes complain if older drivers are used, and new games cannot be added to the test bed because they might not scale correctly due to the older drivers. So while there are some reviews on the internet that update drivers between testing and keeping the old numbers (leading to skewed results), actually taking time out to retest a number of platforms for more data points solely on the new drivers is actually a large undertaking. For example, testing new drivers over six platforms (CPU/motherboard combinations) would mean: six platforms, four games, seven different GPU configurations, ~10 minutes per test plus 2+ hours to set up each platform and install a new OS/drivers/set up benchmarks. That makes 40+ hours of solid testing (if all goes without a second lost here or there), or just over a full working week – more if I also test the CPU performance for a computational benchmark update, or exponentially more if I include multiple resolutions and setting options. If this is all that is worked on that week, it means no new content – so it happens rarely, perhaps once a year or before a big launch. This time was now, and when I started this testing, I was moving to Catalyst 13.1 and GeForce 310.90, which by the time this review goes live will have already been superseded! In reality, I have been slowly working on this data set for the best part of 10 weeks while also reviewing other hardware (but keeping those reviews with consistent driver comparisons). In total this review encapsulates 24 different CPU setups, with up to 6 different GPU configurations, meaning 430 data points, 1375 benchmark loops and over 51 hours in just GPU benchmarks alone.
What Does the CPU do in a Game?
A lot of game developers use customized versions of game engines, such as the EGO engine for driving games or the Unreal engine. The engine provides the underpinnings for a lot of the code, and the optimizations therein. The engine also decides what in the game gets offloaded onto the GPU.
Imagine the code that makes up the game as a linear sequence of events in order. In order to go through the game quickly, we need the fastest single core processor available. Of course, games are not like this – lots of the game can be parallelized, such as vector calculations for graphics. These were of course the first to be moved from CPU to the GPU. Over time, more parts of the code have made the move – physics and compute being the main features in recent months and years.
The GPU is good at independent, simple tasks – calculating which color is in which pixel is an example of this, along with addition processing and post-processing features (FXAA and so on). If a task is linear, it lives on the CPU, such as loading textures into memory or negotiating which data to transfer between the memory and the GPUs. The CPU also takes control of independent complex tasks, as the CPU is the one that can make complicated logic analysis.
Very few parts of a game come under this heading of ‘independent yet complex’. Anything suitable for the GPU but not ported over will be here, and the big one usually quoted is artificial intelligence. Deciding where an NPC is going to run, shoot or fly could be considered a very complex set of calculations, ideal for fast CPUs. The counter argument is that games have had complex AI for years – the number of times I personally was destroyed by a Dark Sim on Perfect Dark on the N64 is testament to either my uselessness or the fact that complex AI can be configured with not much CPU power. AI is unlikely to be a limiting factor in frame rates due to CPU usage.
What is most likely going to be the limiting factor is how the CPU can manage data. As engines evolve, they try and use data between the CPU, memory and GPUs less – if textures can be kept on the GPU, then they will stay there. But some engines are not as perfect as we would like them to be, resulting in the CPU as the limiting factor. As CPU performance increases, and those that write the engines in which games are made understand the ecosystem, CPU performance should be less of an issue over time. All roads point towards the PS4 of course, and its 8-core Jaguar processor. Is this all that is needed for a single GPU, albeit in a HSA environment?
Multi-GPU Testing
Another angle I wanted to test beyond most other websites is multi-GPU. There is content online dealing mostly with single GPU setups, with a few for dual GPU. Even though the numbers of multi-GPU users is actually quite small globally, the enthusiast markets are clearly geared for it. We get motherboards with support for 4 GPU cards; we have cases that will support a dual processor board as well as four double-height GPUs. Then there are GPUs being released with two sets of silicon on a PCB, wrapped in a double or triple height cooler. More often than not on a forum, people will ask ‘what GPU for $xxx’ and some of the suggestions will be towards two GPUs at half the budget, as it commonly offers more performance than a single GPU if the game and the drivers all work smoothly (at the cost of power, heat, and bad driver scenarios). The ecosystem supports multi-GPU setups, so I felt it right to test at least one four-way setup. Although with great power comes great responsibility – there was no point testing 4-way 7970s on 1080p. Typically in this price bracket, users will go for multi-monitor setups, along the lines of 5760x1080, or big monitor setups like 1440p, 1600p, or the mega-rich might try 4K. Ultimately the high end enthusiast, with cash to burn, is going to gravitate towards 4K, and I cannot wait until that becomes a reality. So for a median point in all of this, we are testing at 1440p and maximum settings. This will put the strain on our Core2Duo and Celeron G465 samples, but should be easy pickings for our multi-processor, multi-GPU beast of a machine.
A Minor Problem In Interpreting Results
Throughout testing for this review, there were clearly going to be some issues to consider. Chiefly of which is one of consistency and in particular if something like Metro 2033 decides to have an ‘easy’ run which reports +3% higher than normal. For that specific example we get around this by double testing, as the easy run typically appears in the first batch – so we run two or three batches of four and disregard the first batch.
The other, perhaps bigger, issue is interpreting results. If I get 40.0 FPS on a Phenom II X4-960T, 40.1 FPS on an i5-2500K, and then 40.2 FPS on a Phenom II X2-555 BE, does that make the results invalid? The important points to recognize here are statistics and system state.
- System State: We have all had times when booting a PC and it feels sluggish, but this sluggish behavior disappears on reboot. The same thing can occur with testing, and usually happens as a result of bad initialization or a bad cache optimization routine at boot time. As a result, we try and spot these circumstances and re-run. With more time we would take 100 different measurements of each benchmark, with reboots, and cross out the outliers. Time constraints outside of academia unfortunately do not give us this opportunity.
- Statistics: System state aside, frame rate values will often fluctuate around an average. This will mean (depending on the benchmark) that the result could be +/- a few percentage points on each run. So what happens if you have a run of 4 time demos, and each of them are +2% above the ‘average’ FPS? From the outside, as you will not know the true average, you cannot say if it is valid as the data set is extremely small. If we take more runs, we can find the variance (the technical version of the term), the standard deviation, and perhaps represent the mean, median and mode of a set of results. As always, the main constraint in articles like these is time – the quicker to publish, the less testing, the larger the error bars and the higher likelihood that some results are going to be skewed because it just so happened to be a good/bad benchmark run. So the example given above of the X2-555 getting a better result is down to interpretation – each result might be +/- 0.5 FPS on average, and because they are all pretty similar we are actually more GPU limited. So it is more whether the GPU has a good/bad run in this circumstance.
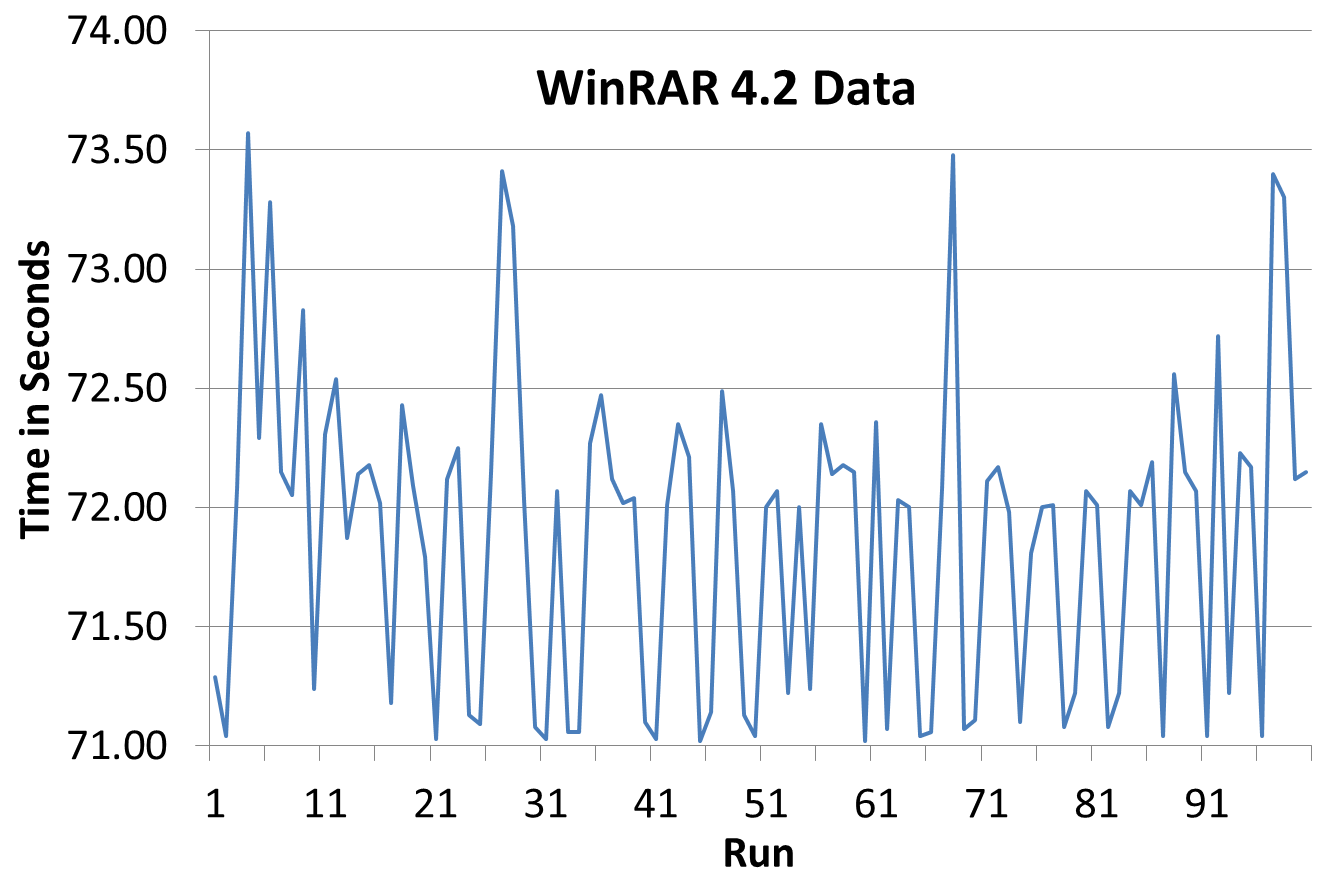
For this example, I batched 100 runs of my common WinRAR test in motherboard testing, on an i5-2500K CPU with a Maximus V Formula. Results varied between 71 seconds and 74 seconds, with a large gravitation towards the lower end. To represent this statistically, we normally use a histogram, which separates the results up into ‘bins’ (e.g. 71.00 seconds to 71.25 seconds) of how accurate the final result has to be. Here is an initial representation of the data (time vs. run number), and a few histograms of that data, using a bin size of 1.00 s, 0.75s, 0.5s, 0.33s, 0.25s and 0.1s.
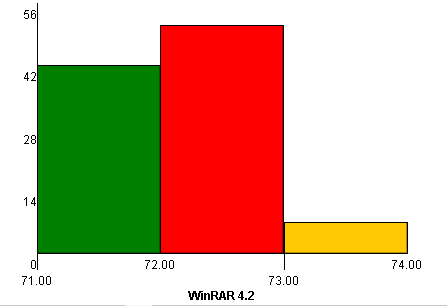
As we get down to the lower bin sizes, there is a pair of large groupings of results between ~71 seconds and ~ 72 seconds. The overall average/mean of the data is 71.88 due to the outliers around 74 seconds, with the median at 72.04 seconds and standard deviation of 0.660. What is the right value to report? Overall average? Peak? Average +/- standard deviation? With the results very skewed around two values, what happens if I do 1-3 runs and get ~71 seconds and none around ~72 seconds?
Statistics is clearly a large field, and without a large sample size, most numbers can be one-off results that are not truly reflective of the data. It is important to ask yourself every time you read a review with a result – how many data points went into that final value, and what analysis was performed?
For this review, we typically take 4 runs of our GPU tests each, except Civilization V which is extremely consistent +/- 0.1 FPS. The result reported is the average of those four values, minus any results we feel are inconsistent. At times runs have been repeated in order to confirm the value, but this will not be noted in the results.
Reporting the Minimum FPS
A lot of readers have noted in the past that they would like to see minimum FPS values. The minimum FPS is a good measure to the point to for the sake of ‘the worst gameplay experience’, but even with our testing, it would be an effort to report it. I know a lot of websites do report minimum FPS, but it is important to realize that:
In a test that places AI in the center of the picture, it can be difficult to remain consistent. Take for example a run of Dirt 3 – this runs a standard race with several AI cars in which anything can happen. If in one of the runs there is a big six-car crash, lots of elements will be going on, resulting in a severe dip in FPS. In this run I get a minimum 6 FPS, whereas in others I get a minimum ~40 FPS. Which is the right number to report? Technically it would be 6 FPS, but then for any CPU that did not have a big crash pile-up, it would look better when theoretically it has not been put to the test.
If I had the time to run 100 tests of each benchmark, I would happily provide histograms of data representing how often the minimum FPS value fluctuated between runs. But that just is not possible when finding a balance between complete testing and releasing results for you all to see.
While I admit that the time-demo benchmarks that are not AI dependent as such will have a more regular minimum FPS, the average FPS result allows the consistency of the run to be petered out. Ideally perhaps we should be reporting the standard deviation (which would help eliminate those stray ultra-low FPS values), but then that brings its own cavalcade of issues whether the run is mainly higher than average or lower than average, and will most likely not be a regular distribution but a skewed distribution.
FCAT Testing
While FCAT is a great way to test frame rates, it needs to be set up accordingly and getting data is not a simple run and gun for benchmark results as one would like – even more complicated in terms of data retrieval and analysis than FRAPS, which personally I tend not to touch with a barge pole. While I understand the merits of such a system, it would be ideal if a benchmark mode used FCAT in its own overlay to report data.
Why Test at 1440p? Most Gamers play at 1080p!
Obviously one resolution is not a catch all situation. There will be users on the cheapest 1080p screen money can buy, and those using tri-monitor setups who want peak performance. Having a multi-GPU test at 1080p is a little strange, personally, and ideally for those high end setups you really need to be pushing the pixels. While 1440p is not the de-facto standard, it provides an ideal mid-point in analysis. Take for example the Steam survey:
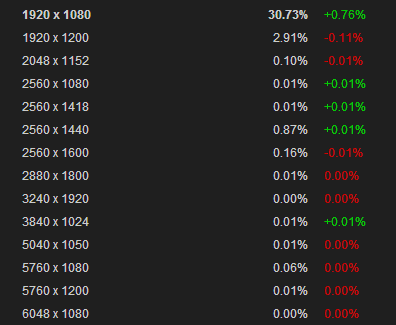
What we see is 30.73% of gamers running at 1080p, but 4.16% of gamers are above 1080p. If that applies to all of the 4.6 million gamers currently on steam, we are talking about ~200,000 individuals with setups bigger than 1080p playing games on Steam right now, who may or may not have to run at a lower resolution to get frame rates.
So 1080p is still the mainstay for gamers at large, but there is movement afoot to multi-monitor and higher resolution monitors. As a random point of data, personally my gaming rig does have a 1080p screen, but that is only because my two 1440p Korean panels are used for AnandTech review testing, such as this article.
The Bulldozer Challenge
Another purpose of this article was to tackle the problem surrounding Bulldozer and its derivatives, such as Piledriver and thus all Trinity APUs. The architecture is such that Windows 7, by default, does not accurately assign new threads to new modules – the ‘freshly installed’ stance is to double up on threads per module before moving to the next. By installing a pair of Windows Updates (which do not show in Windows Update automatically), we get an effect called ‘core parking’, which assigns the first series of threads each to its own module, giving it access to a pair of INT and an FP unit, rather than having pairs of threads competing for the prize. This affects variable threaded loading the most, particularly from 2 to 2N-2 threads where N is the number of modules in the CPU (thus 2 to 6 threads in an FX-8150). It should come as no surprise that games fall into this category, so we want to test with and without the entire core parking features in our benchmarks.
Hurdles with NVIDIA and 3-Way SLI on Ivy Bridge
Users who have been keeping up to date with motherboard options on Z77 will understand that there are several ways in order to put three PCIe slots onto a motherboard. The majority of sub-$250 motherboards will use three PCIe slots in an PCIe 3.0 x8/x8 + PCIe 2.0 x4 arrangement (meaning x8/x8 from the CPU and x4 from the chipset), allowing either two-way SLI or three-way Crossfire. Some motherboards will use a different Ivy Bridge lane allocation option such that we have a PCIe 3.0 x8/x4/x4 layout, giving three-way Crossfire but only two-way SLI. In fact in this arrangement, fitting the final x4 with a sound/raid card disables two-way SLI entirely.
This is due to a not widely publicized requirement of SLI – it needs at least an x8 lane allocation in order to work (either PCIe 2.0 or 3.0). Anything less than this on any GPU and you will be denied in the software. So putting in that third card will cause the second lane to drop to x4, disabling two-way SLI. There are motherboards that have a switch to change to x8/x8 + x4 in this scenario, but we are still capped at two-way SLI.
The only way to go onto 3-way or 4-way SLI is via a PLX 8747 enabled motherboard, which greatly enhances the cost of a motherboard build. This should be kept in mind when dealing with the final results.
Power Usage
It has come to my attention that even if the results were to come out X > Y, some users may call out that the better processor draws more power, which at the end of the day costs more money if you add it up over a year. For the purposes of this review, we are of the opinion that if you are gaming on a budget, then high-end GPUs such as the ones used here are not going to be within your price range. Simple fun gaming can be had on a low resolution, limited detail system for not much money – for example at a recent LAN I went to I enjoyed 3-4 hours of TF2 fun on my AMD netbook with integrated HD3210 graphics, even though I had to install the ultra-low resolution texture pack and mods to get 30+ FPS. But I had a great time, and thus the beauty of high definition graphics of the bigger systems might not be of concern as long as the frame rates are good. But if you want the best, you will pay for the best, even if it comes at the electricity cost. Budget gaming is fine, but this review is designed to focus at 1440p with maximum settings, which is not a budget gaming scenario.
Format Of This Article
On the next couple of pages, I will be going through in detail our hardware for this review, including CPUs, motherboards, GPUs and memory. Then we will move to the actual hardware setups, with CPU speeds and memory timings (with motherboards that actually enable XMP) detailed. Also important to note is the motherboards being used – for completeness I have tested several CPUs in two different motherboards because of GPU lane allocations. We are living in an age where PCIe switches and additional chips are used to expand GPU lane layouts, so much so that there are up to 20 different configurations for Z77 motherboards alone. Sometimes the lane allocation makes a difference, and it can make a large difference using three or more GPUs (x8/x4/x4 vs. x16/x8/x8 with PLX), even with the added latency sometimes associated with the PCIe switches. Our testing over time will include the majority of the PCIe lane allocations on modern setups – for our first article we are looking at the major ones we are likely to come across.
The results pages will start with a basic CPU analysis, running through my regular motherboard tests on the CPU. This should give us a feel for how much power each CPU has in dealing with mathematics and real world tests, both for integer operations (important on Bulldozer/Piledriver/Radeon) and floating point operations (where Intel/NVIDIA seem to perform best).
We will then move to each of our four gaming titles in turn, in our six different GPU configurations. As mentioned above, in GPU limited scenarios it may seem odd if a sub-$100 CPU is higher than one north of $300, but we hope to explain the tide of results as we go.
I hope this will be an ongoing project here at AnandTech, and over time we can add more CPUs, 4K testing, perhaps even show four-way Titan should that be available to us. The only danger is that on a driver or game change, it takes another chunk of time to get data! Any suggestions of course are greatly appreciated – drop me an email at ian@anandtech.com.


116 Comments
View All Comments
TheJian - Wednesday, June 5, 2013 - link
So if you take out the 1920x1200 from the steam survey (4.16 - 2.91% right?), you've written an article for ~1.25% of the world. Thanks...I always like to read about the 1% which means absolutely nothing to me and well, 98.75% of the world.WHO CARES? As hardocp showed even a Titan still can't turn on EVERY detail at even 1920x1080. I would think your main audience is the 99% with under $1000 for a video card (or worse for multigpu) and another $600-900 for a decent 1440p monitor you don't have to EBAY from some dude in Korea.
Whatever...The midpoint to you is a decimal point of users (your res is .87%, meaning NOT ONE PERCENT & far less have above that so how is that midpoint? I thought you passed MATH)?...Quit wasting time on this crap and give us FCAT data like pcper etc (who seems to be able to get fcat results into EVERY video card release article they write).
"What we see is 30.73% of gamers running at 1080p, but 4.16% of gamers are above 1080p. If that applies to all of the 4.6 million gamers currently on steam, we are talking about ~200,000 individuals with setups bigger than 1080p playing games on Steam right now, who may or may not have to run at a lower resolution to get frame rates."
That really should read ~55,000 if you take away the 2.91% that run 1920x1200. And your gaming rig is 1080p because unless you have a titan (which still has problems turning it all on MAX according to hardocp etc to remain playable) you need TWO vid cards to pull off higher than 1920x1200 without turning off details constantly. If you wanted to game on your "Korean ebay special" you would (as if I'd ever give my CC# to some DUDE in a foreign country as Ryan suggested in the 660TI comment section to me, ugh). It's simply a plug change to game then a plug change back right? Too difficult for a Doctor I guess? ;)
This article needs to be written in 3 years maybe with 14nm gpus where we might be able to run a single gpu that can turn it all on max and play above 30fps while doing it and that will still be top rung, as I really doubt maxwell will do this, I'm sure they will still be turning stuff off or down to stay above 30fps min, just as Titan has to do it for 1080p now. Raise your hand if you think a $500 maxwell card will be 2x faster than titan.
1440p yields an overall pixel count of 3,686,400 pixels for a monitor in 1440p resolution, substantially higher than the 2,073,600 pixels found on a 1080p monitor/tv etc. So since Titan is SHORT of playing ALL games maxed on 1080p we would need ~2x the power at say $500 for it to be even called anywhere NEAR mainstream at 1440p right? I don't see NV's $500 range doing 2x Titan with maxwell and that is 6-9 months away (6 for AMD volcanic, ~7-9 for NV?). Raise your hand if you call $500 mainstream...I see no hands. They may do this at 14nm for $300 but this is a long ways off right and most call $200 mainstream right? Hence I say write this in another 3yrs when the 1080p number of users in the steam survey (~31%) is actually the 1440p#. Quit writing for .87% please and quit covering for AMD with FCAT excuses. We get new ones from this site with every gpu article. The drivers changed, some snafu that invalidated all our data, not useful for this article blah blah, while everyone else seems to be able to avoid all anandtech's issues with FCAT and produce FCAT after FCAT results. Odd you are the ONLY site AMD talked too directly (which even Hilbert at Guru3d mentions...rofl). Ok, correction. IT'S NOT ODD. AMD personal attention to website=no fcat results until prototype/driver issues are fixed....simple math.
http://www.alexa.com/siteinfo/anandtech.com#
Judging your 6 month traffic stats I'd say you'd better start writing REAL articles without slants before your traffic slides to nothing. How much more of a drop in traffic can you guys afford before you switch off the AMD love? Click the traffic stats tab. You have to be seeing this right Anand? Your traffic shows nearly in half since ~9 months ago and the 660TI stuff. :) I hope this site fixes it's direction before Volcanic & Maxwell articles. I might have to start a blog just to pick the results of those two apart along with very detailed history of the previous articles and comments sections on them. All in one spot for someone to take in at once I'm sure many would be able to do the math themselves and draw some startling conclusions about the last year on this site and how it's changed. I can't wait for Ryan's take on the 20nm chips :)
Laststop311 - Wednesday, June 5, 2013 - link
Who actually buys a computer and does nothing but game on it every second they are on it? That's why the A8-5600k should not be the recommended cpu. Just gonna drag you down in every other thing you do with the computer. The i5-2500k should be here too. You can get them for a STEAL on ebay used I've seen them go for around 140-150. Sure you can pay 100-110 on ebay for the a8-5600k is a 40 dollar savings worth that much performance loss?TheJian - Sunday, June 9, 2013 - link
I didn't even go into this aspect (it's not just about gaming as you say clearly). But thanks for making the other 1/2 of my argument for me :)Your statement plus mine makes this whole article & it's conclusions ridiculous. Most people buy a PC and keep it for over 3yrs, meaning you'll be punished for a LONG time every day in everything you do (gaming, ripping, rar, photos etc etc). AMD cpu's currently suck for anyone but very poor people. Even for the poor, I'd say save for another month or two as $50-100 changes the world for years for your computing no matter what you'll use it for. Or axe your vid card for now and by a higher end intel. Survive for a bit until you can afford a card to go into your machine. AMD just isn't worth it for now on desktops. I'm an AMD fan, but the computing experience on Intel today is just better all around if you ever intend on putting in a discrete card worth over say $100 and this comment only gets worse as gpu's improve leaving your cpu behind.
You will get more cpu limited every year. Also it's much easier to change gpu's vs cpu's (which usually requires a new board for substantial gains unless you really buy on the low-end). Having said that, buying low-end haswell today gets you a broadwell upgrade later which should yield some decent gains since it's 14nm. Intel is just hard to argue against currently and that is unfortunate for AMD since the bulk of their losses is CPU related and looks to just get worse (the gpu division actually made ~15mil or so, while cpu side lost 1.18B!). Richland changes nothing here, just keeps the same audience it already had for total losses. They need a WINNER to get out of losses. Consoles may slow the bleeding some, but won't fix the losses. Steamroller better be 30-40% faster (10-20% is not enough, it will again change nothing).
firefreak111 - Wednesday, June 5, 2013 - link
Quote: What we see is 30.73% of gamers running at 1080p, but 4.16% of gamers are above 1080p. If that applies to all of the 4.6 million gamers currently on steam, we are talking about ~200,000 individuals with setups bigger than 1080p playing games on Steam right now, who may or may not have to run at a lower resolution to get frame rates.Wrong. 2.91% is 1200p (1080p at a 16:10 ratio), which is barely higher resolution. 1.25% are truly above 1440p, a much smaller number. ~57 000 gamers compared to 1,380,000 gamers... I respect 1440p, getting a new system to play at that res, but the mainstream isn't any time soon.
I wish I could take this article seriously. You choose 4 games to recommend a CPU (Metro 2033, GPU Bound, Dirt 3, racing game focused on graphics, Civ V, which you knock off as unimportant based on FPS not turn times (which is all anyone really cares about in the late-game) and Sleeping Dogs, which is Open World but doesnt have complex scripting or AI.) and then choose AMD based on 3/4 of the games which are GPU bound and thus not favoring the faster Intel CPU's much?
FPS will only get you so far. Smoothness will be better on the faster CPU's. Anyway, most importantly, if you want to have a serious article with a good recommendation, how about testing CPU bound modern games? Shogun 2, mass AI calculations for many units combined with complex turn times (which is very important in any turn based game). Skyrim, with actually complex AI and large amounts of scripting, which uses the CPU to its utmost. Crysis 3, a good test for a balance of CPU and GPU focus. BF3 Multiplayer, which from personal experience needs a good CPU to play well.
Use Nvidia and AMD GPU's, one could favor the other leading to a better recommendation (This brand for this CPU). Civ V will see large performance gains on a Nvidia card combined with a good CPU, due to its use of deferred contexts (dx11 multithreading) and Nvidia's support of it (AMD seriously needs to step up and support it, most game engines aren't because AMD isn't. Its built into DX11, so support it AMD!).
Lastly, recommend for the mainstream. 1080p is the mainstream. Not 1440p+, which is 1.25% of steam players, 1080, which is more than 30%.
CiccioB - Wednesday, June 5, 2013 - link
I wonder what's the meaning of conducting such a big effort like this to test CPU performances and then making all the systems GPU bottlenecked just to take into consideration 4% of the gaming population.Moreover, some test done with an "old" GTX580 which bottlenecks in those resolution quite soon.
I renew my request of updating the list of games used and using most "popular" video settings in order to make a real comparison of what a gamer may find using the usual setup it may use at home. Monitor bigger than 24" are not popular at all.
Maybe an integration with a SLI/Tri SLI setup and a 5800x resolution may be added, but surely that should not be considered the way things work normally and taken a sdefinitive benchmark results to get some obviously confusing conclusions.
An A10-xxxx is way way behind any i5 CPU, and often even behind some i3 in realgaming. I can't really understand how one can believe in such a suggestion.
I am starting to think that something else rather than objective results are being created and shown here.
TheJian - Sunday, June 9, 2013 - link
AMD only visited ONE website in recent history. ANANDTECH.Also note they pushed this 1440p idea when the numbers were EVEN WORSE in the 660TI article comments section (and even the articles conclusions, we're talking 9 months ago - 1440p is STILL not popular nor above it). See Ryan's exchange in that article with me. He was pushing the Korean Ebay dude then...ROFL. I pointed out then that amazon only had 2 people selling them and they had no reviews (ONE, which was likely the guy that owned the place selling it), no support page, no phone, and their website wasn't even their own domain and email was a gmail address if memory serves. Essentially giving your CC# to some dude in Korea and praying. Which another site mentioned he did pray when ordering a test unit...LOL Techreport's 1440p korean review back then if memory serves. Yet Ryan claimed everyone in the forums was doing this...Whatever... Don't even get me started on Jared's personal attack while ignoring my copious amounts of data proving Ryan's article BS even with using Ryan's own previous article's benchmarks! It's kind of hard to argue against your own data right?
I sincerely hope this site goes back to producing articles on cpu/gpu that are worthy of reading. These days all they do is hide AMD's inadequacies vs. Intel and NV. They are the only site saying things like "buy an A8-5600 for any SINGLE gpu machines"...I can't believe how far they've gone in the last 9 months. Their traffic stats show I'm not alone. The comments here show I'm not alone. AMD can't be paying them enough to throw their whole reputation down the drain. Look what the Sysmark/Bapco/Van Smith scandal did to Tomshardware (Tom even changed all his bylines to "tom's staff" or some crap like that). He had to sell at far less than the site was worth before the damage, and it took years to get back to a better reputation and wash off the stink. Heck I stopped reading in disgust for years and many IT friends did the same. I mean they were running Intel ads in AMD review articles...LOL. I think that is just wrong (the van smith stuff was just unconscionable). For those who remember Van, he still writes occasionally at brightsideofnews.com (I only recently discovered this, also writes on vanshardware but not much analysis stuff). Good to see that.
Pjotr - Wednesday, June 5, 2013 - link
What happened to the Q9400 in the GPU charts, it's missing? No, I didn't read the full article.HappyHubris - Wednesday, June 5, 2013 - link
I know this was addressed in the article, but no 2013 gaming part recommendation should be published based on average FPS.Any Ivy Bridge i3 mops the floor with a 5800K, and I'd imagine that Sandy-based i3s would do so even cheaper. http://techreport.com/review/23662/amd-a10-5800k-a...
Kudos on an article that includes older processors, though...it's nice to see more than 1 or 2 generations in a review.
ArXiv76 - Wednesday, June 5, 2013 - link
Having read technical articles, white papers and tech reviews for over 25 years I can't remember ever reading a "finding perfection" examination. My hypothesis is, does there exist a CPU(all CPU's tested) to GPU(all OEM's tested) mix that is ideal. Obviously speed is king so I am thinking more from an engineering perspective.Does this exist?
Steam and EA online are both great services. If there is a service that takes away physical media it's a huge winner to me. I still have my piles Sierra game boxes stored away.
bigdisk - Wednesday, June 5, 2013 - link
Oh, Anand / Ian CutressYou really shouldn't put your benchmark title and settings within an image. You absolutely want this as text in the page for SEO.
Cheers, good article.