NVIDIA GeForce GTX 780 Review: The New High End
by Ryan Smith on May 23, 2013 9:00 AM ESTSoftware, Cont: ShadowPlay and "Reason Flags"
Along with providing the game optimization service and SHIELD’s PC client, GeForce Experience has another service that’s scheduled to be added this summer. That service is called ShadowPlay, and not unlike SHIELD it’s intended to serve as a novel software implementation of some of the hardware functionality present in NVIDIA’s latest hardware.
ShadowPlay will be NVIDIA’s take on video recording, the novel aspect of it coming from the fact that NVIDIA is basing the utility around Kepler’s hardware H.264 encoder. To be straightforward video recording software is nothing new, as we have FRAPS, Afterburner, Precision X, and other utilities that all do basically the same thing. However all of those utilities work entirely in software, fetching frames from the GPU and then encoding them on the CPU. The overhead from this is not insignificant, especially due to the CPU time required for video encoding.
With ShadowPlay NVIDIA is looking to spur on software developers by getting into video recording themselves, and to provide superior performance by using hardware encoding. Notably this isn’t something that was impossible prior to ShadowPlay, but for some reason recording utilities that use NVIDIA’s hardware H.264 encoder have been few and far between. Regardless, the end result should be that most of the overhead is removed by relying on the hardware encoder, minimally affecting the GPU while freeing up the CPU, reducing the amount of time spent on data transit back to the CPU, and producing much smaller recordings all at the same time.
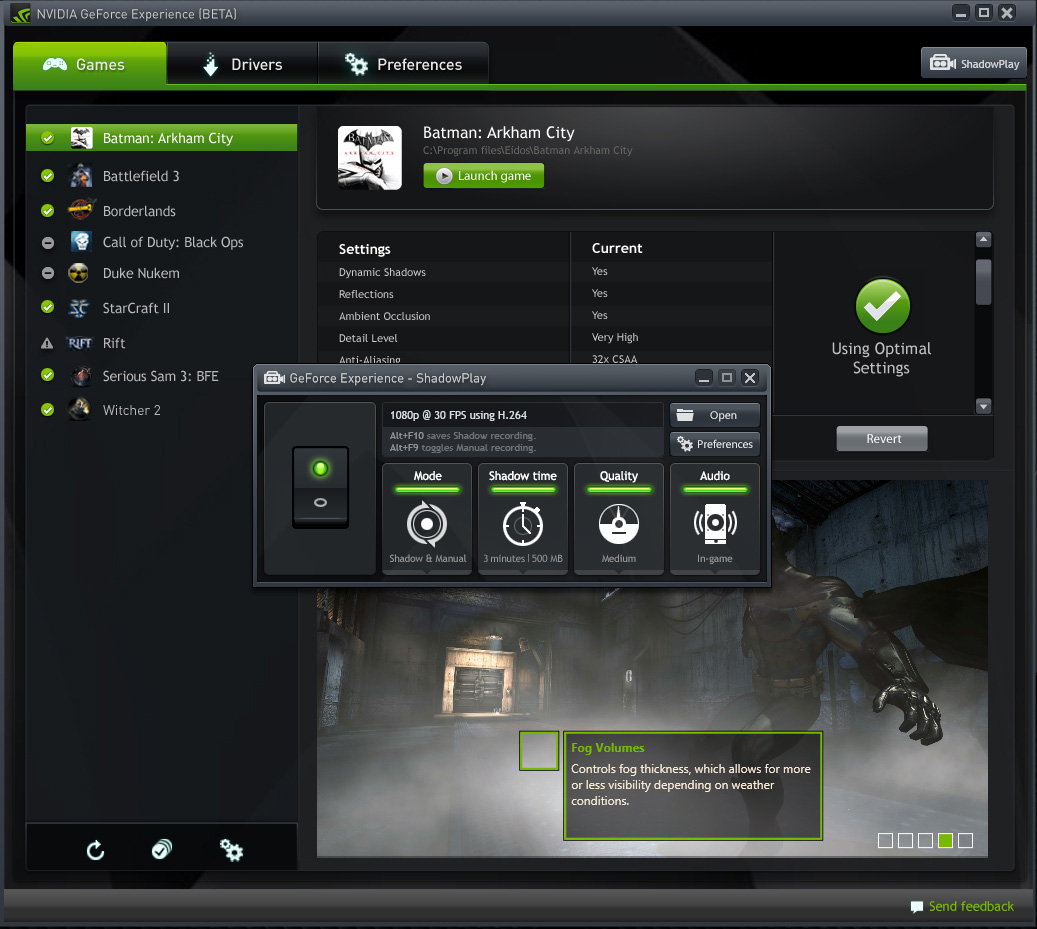
ShadowPlay will feature multiple modes. Its manual mode will be analogous to FRAPS, recording whenever the user desires it. The second mode, shadow mode, is perhaps the more peculiar mode. Because the overhead of recording with the hardware H.264 encoder is so low, NVIDIA wants to simply record everything in a very DVR-like fashion. In shadow mode the utility keeps a rolling window of the last 20 minutes of footage, with the goal being that should something happen that the user decides they want to record after the fact, they can simply pull it out of the ShadowPlay buffer and save it. It’s perhaps a bit odd from the perspective of someone who doesn’t regularly record their gaming sessions, but it’s definitely a novel use of NVIDIA’s hardware H.264 encoder.
NVIDIA hasn’t begun external beta testing of ShadowPlay yet, so for the moment all we have to work from is screenshots and descriptions. The big question right now is what the resulting quality will be like. NVIDIA’s hardware encoder does have some limitations that are necessary for real-time encoding, so as we’ve seen in the past with qualitative looks at NVIDIA’s encoder and offline H.264 encoders like x264, there is a quality tradeoff if everything has to be done in hardware in real time. As such ShadowPlay may not be the best tool for reference quality productions, but for the YouTube/Twitch.tv generation it should be more than enough.
Anyhow, ShadowPlay is expected to be released sometime this summer. But since 95% of the software ShadowPlay requires is also required for the SHIELD client, we wouldn’t be surprised if ShadowPlay was released shortly after a release quality version of the SHIELD client is pushed out, which may come as early as June alongside the SHIELD release.
Reasons: Why NVIDIA Cards Throttle
The final software announcement from NVIDIA to coincide with the launch of the GTX 780 isn’t a software product in and of itself, but rather an expansion of NVIDIA’s 3rd party hardware monitoring API.
One of the common questions/complaints about GPU Boost that NVIDIA has received over the last year is about why a card isn’t boosting as high as it should be, or why it suddenly drops down a boost bin or two for no apparent reason. For technically minded users who know the various cards’ throttle points and specifications this isn’t too complex – just look at the power consumption, GPU load, and temperature – but that’s a bit much to ask of most users. So starting with the recently released 320.14 drivers, NVIDIA is exposing a selection of flags through their API that indicate what throttle point is causing throttling or otherwise holding back the card’s clockspeed. There isn’t an official name for these flags, but “reasons” is as good as anything else, so that’s what we’re going with.
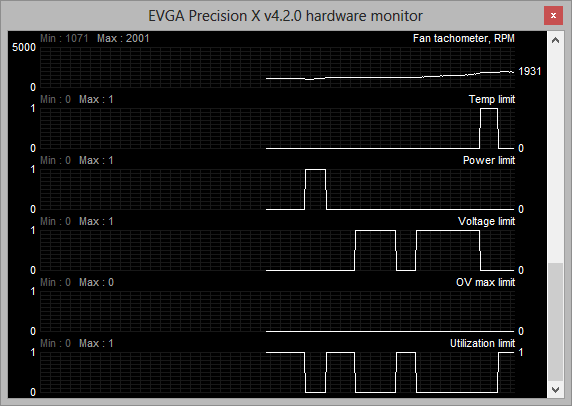
The reasons flags are a simple set of 5 binary flags that NVIDIA’s driver uses to indicate why it isn’t increasing the clockspeed of the card further. These flags are:
- Temperature Limit – the card is at its temperature throttle point
- Power Limit – The card is at its global power/TDP limit
- Voltage Limit – The card is at its highest boost bin
- Overvoltage Max Limit – The card’s absolute maximum voltage limit (“if this were to occur, you’d be at risk of frying your GPU”)
- Utilization Limit – The current workload is not high enough that boosting is necessary
As these are simple flags, it’s up to 3rd party utilities to decide how they want to present these flags. EVGA’s Precision X, which is NVIDIA’s utility of choice for sampling new features to the press, simply records the flags like it does the rest of the hardware monitoring data, and this is likely what most programs will do.
With the reason flags NVIDIA is hoping that this will help users better understand why their card isn’t boosting as high as they’d like to. At the same time the prevalence of GPU Boost 2.0 and its much higher reliance on temperature makes exposing this data all the more helpful, especially for overclockers that would like to know what attribute they need to turn up to unlock more performance.


155 Comments
View All Comments
littlebitstrouds - Thursday, May 23, 2013 - link
Being a system builder for video editors, I'd love to get some video rendering performance numbers.TheRealArdrid - Thursday, May 23, 2013 - link
The performance numbers on Far Cry 3 really show just how poorly Crysis was coded. There's no reason why new top-end hardware should still struggle on a 6 year old game.zella05 - Thursday, May 23, 2013 - link
Just no. crysis looks way better than farcry 3. dont forget, crysis is a pc game, farcry is a console portRyan Smith - Thursday, May 23, 2013 - link
On a side note, I like Far Cry 3, but I'd caution against using it as a baseline for a well forming game. It's an unusually fussy game. We have to disable HT to make it behave, and the frame pacing even on single GPU cards is more variable than what we see in most other games.zella05 - Thursday, May 23, 2013 - link
there has to be something wrong with your testing? how on earth can 2560x1440 only shave 1fps of all those cards? impossible. I have dual 580s on a dell 1440p monitor and I can say with complete conviction that when playing Crysis 3 you lose at LEAST 10% frame rate. Explain yourselves?WeaselITB - Thursday, May 23, 2013 - link
There are two 1080p graphs -- one "High Quality" and one "Very High Quality" ... the 1440p graph is "High Quality."Comparing HQ between the two gives 79.4 to 53.1 for the 780 ... seems about right to me.
-Weasel
BrightCandle - Thursday, May 23, 2013 - link
Both of your measures taken from FCAT have issues which I will try to explain below.1) The issue with the 95% point
If we take a game where 5% of the frames are being produced very inconsistently then the 95% point wont capture the issue. But worse is the fact that a 1 in 100 frame that takes twice as long is very noticeable when playing to everyone. Just 1% of the frames having an issue is enough to see a noticeable problem. Our eyes don't work by taking 95% of the frames, our eyes require a level of consistency on all frames. Thus the 95% point is not the eqvuialent of minimum FPS, that would be the 100% point. The 95% point is arbitary and ultimately not based on how we perceive the smoothness of frames. It captures AMDs current crossfire issue but it fails to have the resolution necessary as a metric to capture the general problem and compare single cards.
2) The issue with the delta averaging
By comparing to the average frame time this method would incorrectly categorise clearly better performing cards. Its the same mistake Tomshardware made. In essence if you have a game and sometimes that game is CPU limited (common) and then GPU limited the two graphics cards will show similar frame rates at some moments and the faster of them will show dramatically higher performance at other times. This makes the swing from the minimum/average to the high fps much wider. But it could be a perfectly consistent experience in the sense that frame to frame for the most part the variation is minimal. Your calculation would tell us the variation of the faster card was a problem, when actually it wasn't.
The reason that measure isn't right is that it fails to recognise the thing we humans see as a problem. We have issue with individual frames that take a long time. We also have issues with inconsistent delivery of animation in patterns. If we take 45 fps for example the 16/32/16/32 pattern that can produce in vsync is highly noticeable. The issue is that frame to frame we are seeing variation. This is why all the other review sites show the frame times, because the stuttering on a frame by frame basis really matters.
We don't particularly have issues with a single momentary jump up or down in frame rate, we might notice them but its momentary and then we adapt rapidly. What our brains do not adapt to rapidly is continuous patterns of odd delivery of frames. Thus any measure where you try to reduce the amount of data needs to be based on that moment by moment variation between individual or small numbers of frames, because big jumps up and down in fps that last for 10s of seconds are not a problem, the issue is the 10ms swing between two individual frames that keeps happening. You could look for patterns, you could use signal frequency analysis and various other techniques to tune out the "carrier" signal of the underlying FPS. But what you can't do is compare it to the average, that just blurs the entire picture. A game that started at 30 fps for half the trace and then was 60 fps for half the trace with no other variation is vastly better than one that continuously oscillates between 30 and 60 fps every other frame.
Its also important to understand that you analysis is missing fraps. Fraps isn't necessarily good for measuring what the cards are doing but it is essentially the best current way to measure what the game engine is doing. The GPU is impacting on the game simulation and its timing and variation in this affects what goes into the frames. So while FCAT captures if the frames come out smoothly it does not tell us anything about whether the contents is at the right time, fraps is what does that. NVidia is downplaying that tool because they have FCAT and are trying to show off their frame metering and AMD is downplaying it because their cards have issues but it is still a crucial measure. The ideal picture is both that the fraps times are consistent and the FCAT measures are consistent, they after all measure the input into the GPU and the output and we need both to get a true picture of the sub component.
Thus I am of the opinion your data doesn't currently show what you thought it did and your analysis needs work.
rscsrAT - Thursday, May 23, 2013 - link
As far as I understood the delta averaging, it adds the time difference between two adjacent frames.To make it clear, if you have 6 frames with 16/32/16/32/16/32ms per frame, you would calculate the value with (5*16)/((3*16+3*32)/6)=333%.
But if you have 6 framse with 16/16/16/32/32/32ms per frame, you would have 16/((3*16+3*32)/6)=67%.
Therefore you still have a higher value for a higher fluctuating framerate than with a steady framerate.
WeaselITB - Thursday, May 23, 2013 - link
For your #1 -- 95th percentile is a pretty common statistical analysis tool http://en.wikipedia.org/wiki/68-95-99.7_rule ... I'm assuming that they're assuming a normal distribution, which intuitively makes sense given that you'd expect most results to be close to the mean. I'd be interested in seeing the 3-sigma values, as that would further point out the extreme outliers, and would probably satisfy your desire for the "1%" as well.For your #2 -- they're measuring what you're describing, the differences between individual frametimes. Compare their graphs on the "Our First FCAT" page between the line graph of the frametimes of the cards and the bar graph after they massaged the data. The 7970GE has the smallest delta percentage, and the tightest line graph. The 7990 has the largest delta percentage (by far), and the line graph is all over the place. Their methodology of coming up with the "delta percentage" difference is sound.
-Weasel
jonjonjonj - Thursday, May 23, 2013 - link
amd get your act together so we have some competition. i really don't even see the point to this card at this price. what are they going to do for the 770? sell and even more crippled GK110 for $550? and the 760ti will be $450? or are they just going to sell the the 680 as a 770?