NVIDIA GeForce GTX 780 Review: The New High End
by Ryan Smith on May 23, 2013 9:00 AM ESTPower, Temperature, & Noise
As always, last but not least is our look at power, temperature, and noise. Next to price and performance of course, these are some of the most important aspects of a GPU, due in large part to the impact of noise. All things considered, a loud card is undesirable unless there’s a sufficiently good reason – or sufficiently good performance – to ignore the noise.
GTX 780 comes into this phase of our testing with a very distinct advantage. Being based on an already exceptionally solid card in the GTX Titan, it’s guaranteed to do at least as well as Titan here. At the same time because its practical power consumption is going to be a bit lower due to the fewer enabled SMXes and fewer RAM chips, it can be said that it has Titan’s cooler and a lower yet TDP, which can be a silent (but deadly) combination.
| GeForce GTX 780 Voltages | ||||
| GTX 780 Max Boost | GTX 780 Base | GTX 780 Idle | ||
| 1.1625v | 1.025v | 0.875v | ||
Unsurprisingly, voltages are unchanged from Titan. GK110’s max safe load voltage is 1.1625v, with 1.2v being the maximum overvoltage allowed by NVIDIA. Meanwhile idle remains at 0.875v, and as we’ll see idle power consumption is equal too.
Meanwhile we also took the liberty of capturing the average clockspeeds of the GTX 780 in all of the games in our benchmark suite. In short, although the GTX 780 has a higher base clock than Titan (863MHz versus 837MHz), the fact that it only goes to one higher boost bin (1006MHz versus 993MHz) means that the GTX 780 doesn’t usually clock much higher than GTX Titan under load; for one reason or another it typically settles at the boost bin as the GTX Titan on tests that offer consistent work loads. This means that in practice the GTX 780 is closer to a straight-up harvested GTX Titan, with no practical clockspeed differences.
| GeForce GTX Titan Average Clockspeeds | ||||
| GTX 780 | GTX Titan | |||
| Max Boost Clock | 1006MHz | 992MHz | ||
| DiRT:S |
1006MHz
|
992MHz | ||
| Shogun 2 |
966MHz
|
966MHz | ||
| Hitman |
992MHz
|
992MHz | ||
| Sleeping Dogs |
969MHz
|
966MHz | ||
| Crysis |
992MHz
|
992MHz | ||
| Far Cry 3 |
979MHz
|
979MHz | ||
| Battlefield 3 |
992MHz
|
992MHz | ||
| Civilization V |
1006MHz
|
979MHz | ||
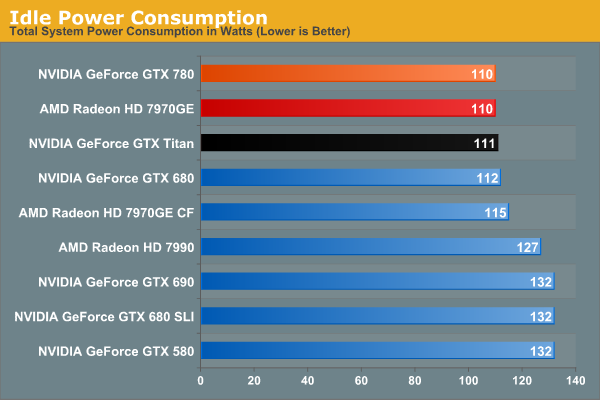
Idle power consumption is by the book. With the GTX 780 equipped, our test system sees 110W at the wall, a mere 1W difference from GTX Titan, and tied with the 7970GE. Idle power consumption of video cards is getting low enough that there’s not a great deal of difference between the latest generation cards, and what’s left is essentially lost as noise.
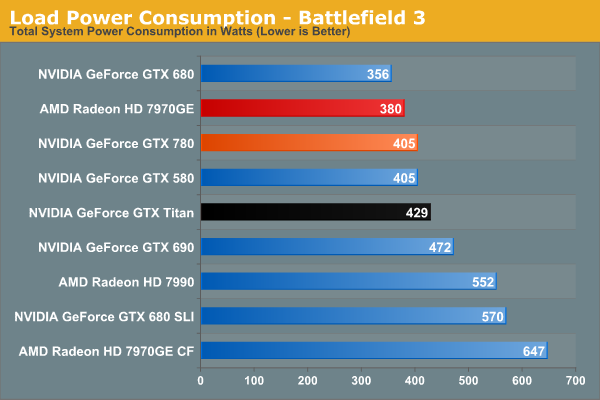
Moving on to power consumption under Battlefield 3, we get our first real confirmation of our earlier theories on power consumption. Between the slightly lower load placed on the CPU from the lower framerate, and the lower power consumption of the card itself, GTX 780 draws 24W less at the wall. Interestingly this is exactly how much our system draws with the GTX 580 too, which accounting for lower CPU power consumption means that video card power consumption on the GTX 780 is down compared to the GTX 580. GTX 780 being a harvested part helps a bit with that, but it still means we’re looking at quite the boost in performance relative to the GTX 580 for a simultaneous decrease in video card power consumption.
Moving along, we see that power consumption at the wall is higher than both the GTX 680 and 7970GE. The former is self-explanatory: the GTX 780 features a bigger GPU and more RAM, but is made on the same 28nm process as the GTX 680. So for a tangible performance improvement within the same generation, there’s nowhere for power consumption to go but up. Meanwhile as compared to the 7970GE, we are likely seeing a combination of CPU power consumption differences and at least some difference in video card power consumption, though this doesn’t make it possible to specify how much of each.
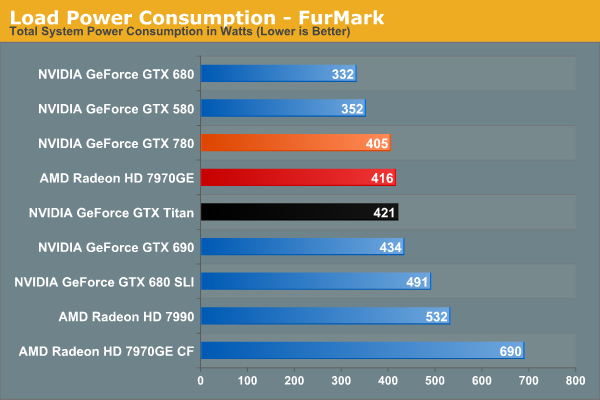
Switching to FurMark and its more pure GPU load, our results become compressed somewhat as the GTX 780 moves slightly ahead of the 7970GE. Power consumption relative to Titan is lower than what we expected it to be considering both cards are hitting their TDP limits, though compared to GTX 680 it’s roughly where it should be. At the same time this reflects a somewhat unexpected advantage for NVIDIA; despite the fact that GK110 is a bigger and logically more power hungry GPU than AMD’s Tahiti, the power consumption of the resulting cards isn’t all that different. Somehow NVIDIA has a slight efficiency advantage here.
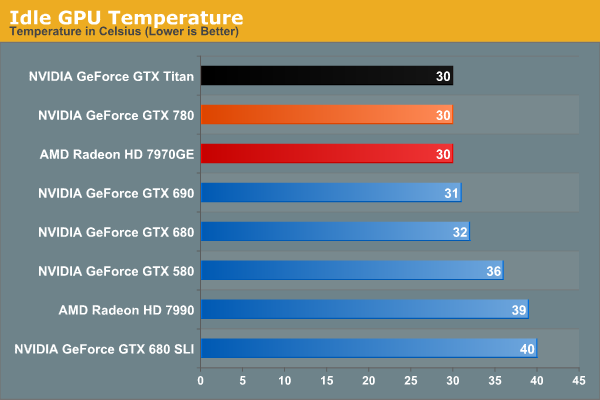
Moving on to idle temperatures, we see that GTX 780 hits the same 30C mark as GTX Titan and 7970GE.
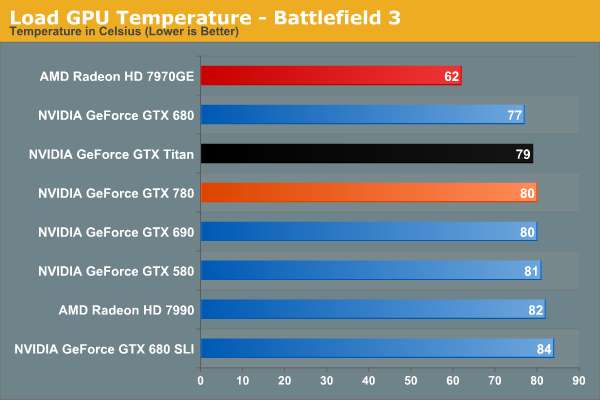
With GPU Boost 2.0, load temperatures are kept tightly in check when gaming. The GTX 780’s default throttle point is 80C, and that’s exactly what happens here, with GTX 780 bouncing around that number while shifting between its two highest boost bins. Note that like Titan however this means it’s quite a bit warmer than the open air cooled 7970GE, so it will be interesting to see if semi-custom GTX 780 cards change this picture at all.
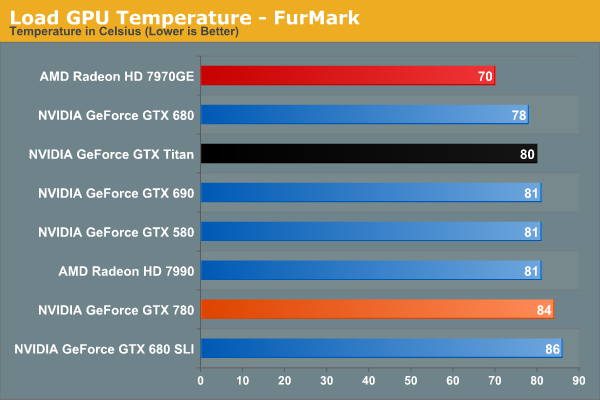
Whereas GPU Boost 2.0 keeps a lid on things when gaming, it’s apparently a bit more flexible on FurMark, likely because the video card is already heavily TDP throttled.
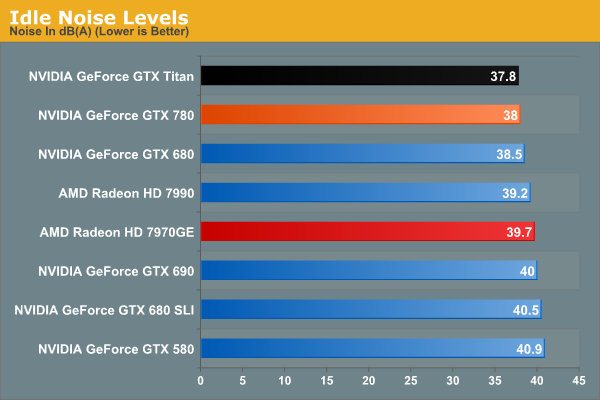
Last but not least we have our look at idle noise. At 38dB GTX 780 is essentially tied with GTX Titan, which again comes at no great surprise. At least in our testing environment one would be hard pressed to tell the difference between GTX 680, GTX 780, and GTX Titan at idle. They’re essentially as quiet as a card can get without being silent.
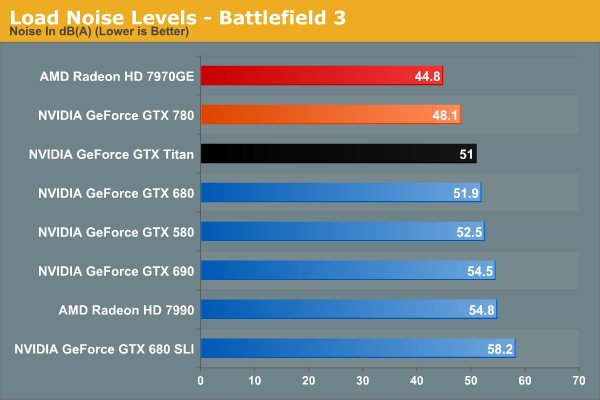
Under BF3 we see the payoff of NVIDIA’s fan modifications, along with the slightly lower effective TDP of GTX 780. Despite – or rather because – it was built on the same platform as GTX Titan, there’s nowhere for idle noise to go down. As a result we have a 250W blower based card hitting 48.1dB under load, which is simply unheard of. At nearly a 4dB improvement over both GTX 680 and GTX 690 it’s a small but significant improvement over NVIDIA’s previous generation cards, and even Titan has the right to be embarrassed. Silent it is not, but this is incredibly impressive for a blower. The only way to beat something like this is with an open air card, as evidenced by the 7970GE, though that does comes with the usual tradeoffs for using such a cooler.
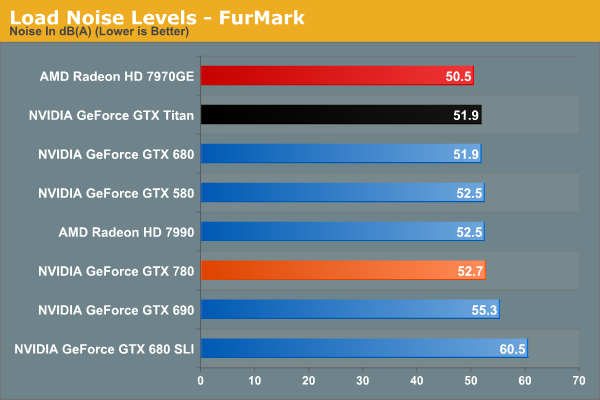
Because of the slightly elevated FurMark temperatures we saw previously, GTX 780 ends up being a bit louder than GTX Titan under FurMark. This isn’t something that we expect to see under any non-pathological workload, and I tend to favor BF3 over FurMark here anyhow, but it does point to there being some kind of minor difference in throttling mechanisms between the two cards. At the same time this means that GTX 780 is still a bit louder than our open air cooled 7970GE, though not by as large a difference as we saw with BF3.
Overall the GTX 780 generally meets or exceeds the GTX Titan in our power, temp, and noise tests, just as we’d expect for a card almost identical to Titan itself. The end result is that it maintains every bit of Titan’s luxury and stellar performance, and if anything improves on it slightly when we’re talking about the all-important aspects of load noise. It’s a shame that coolers such as 780’s are not a common fixture on cheaper cards, as this is essentially unparalleled as far as blower based coolers are concerned.
At the same time this sets up an interesting challenge for NVIDIA’s partners. To pass Greenlight they need to produce cards with coolers that function as good or as better than the reference GTX 780 in NVIDIA’s test environment. This is by no means impossible, but it’s not going to be an easy task. So it will be interesting to see what partners cook up, especially with the obligatory dual fan open air cooled models.


155 Comments
View All Comments
littlebitstrouds - Thursday, May 23, 2013 - link
Being a system builder for video editors, I'd love to get some video rendering performance numbers.TheRealArdrid - Thursday, May 23, 2013 - link
The performance numbers on Far Cry 3 really show just how poorly Crysis was coded. There's no reason why new top-end hardware should still struggle on a 6 year old game.zella05 - Thursday, May 23, 2013 - link
Just no. crysis looks way better than farcry 3. dont forget, crysis is a pc game, farcry is a console portRyan Smith - Thursday, May 23, 2013 - link
On a side note, I like Far Cry 3, but I'd caution against using it as a baseline for a well forming game. It's an unusually fussy game. We have to disable HT to make it behave, and the frame pacing even on single GPU cards is more variable than what we see in most other games.zella05 - Thursday, May 23, 2013 - link
there has to be something wrong with your testing? how on earth can 2560x1440 only shave 1fps of all those cards? impossible. I have dual 580s on a dell 1440p monitor and I can say with complete conviction that when playing Crysis 3 you lose at LEAST 10% frame rate. Explain yourselves?WeaselITB - Thursday, May 23, 2013 - link
There are two 1080p graphs -- one "High Quality" and one "Very High Quality" ... the 1440p graph is "High Quality."Comparing HQ between the two gives 79.4 to 53.1 for the 780 ... seems about right to me.
-Weasel
BrightCandle - Thursday, May 23, 2013 - link
Both of your measures taken from FCAT have issues which I will try to explain below.1) The issue with the 95% point
If we take a game where 5% of the frames are being produced very inconsistently then the 95% point wont capture the issue. But worse is the fact that a 1 in 100 frame that takes twice as long is very noticeable when playing to everyone. Just 1% of the frames having an issue is enough to see a noticeable problem. Our eyes don't work by taking 95% of the frames, our eyes require a level of consistency on all frames. Thus the 95% point is not the eqvuialent of minimum FPS, that would be the 100% point. The 95% point is arbitary and ultimately not based on how we perceive the smoothness of frames. It captures AMDs current crossfire issue but it fails to have the resolution necessary as a metric to capture the general problem and compare single cards.
2) The issue with the delta averaging
By comparing to the average frame time this method would incorrectly categorise clearly better performing cards. Its the same mistake Tomshardware made. In essence if you have a game and sometimes that game is CPU limited (common) and then GPU limited the two graphics cards will show similar frame rates at some moments and the faster of them will show dramatically higher performance at other times. This makes the swing from the minimum/average to the high fps much wider. But it could be a perfectly consistent experience in the sense that frame to frame for the most part the variation is minimal. Your calculation would tell us the variation of the faster card was a problem, when actually it wasn't.
The reason that measure isn't right is that it fails to recognise the thing we humans see as a problem. We have issue with individual frames that take a long time. We also have issues with inconsistent delivery of animation in patterns. If we take 45 fps for example the 16/32/16/32 pattern that can produce in vsync is highly noticeable. The issue is that frame to frame we are seeing variation. This is why all the other review sites show the frame times, because the stuttering on a frame by frame basis really matters.
We don't particularly have issues with a single momentary jump up or down in frame rate, we might notice them but its momentary and then we adapt rapidly. What our brains do not adapt to rapidly is continuous patterns of odd delivery of frames. Thus any measure where you try to reduce the amount of data needs to be based on that moment by moment variation between individual or small numbers of frames, because big jumps up and down in fps that last for 10s of seconds are not a problem, the issue is the 10ms swing between two individual frames that keeps happening. You could look for patterns, you could use signal frequency analysis and various other techniques to tune out the "carrier" signal of the underlying FPS. But what you can't do is compare it to the average, that just blurs the entire picture. A game that started at 30 fps for half the trace and then was 60 fps for half the trace with no other variation is vastly better than one that continuously oscillates between 30 and 60 fps every other frame.
Its also important to understand that you analysis is missing fraps. Fraps isn't necessarily good for measuring what the cards are doing but it is essentially the best current way to measure what the game engine is doing. The GPU is impacting on the game simulation and its timing and variation in this affects what goes into the frames. So while FCAT captures if the frames come out smoothly it does not tell us anything about whether the contents is at the right time, fraps is what does that. NVidia is downplaying that tool because they have FCAT and are trying to show off their frame metering and AMD is downplaying it because their cards have issues but it is still a crucial measure. The ideal picture is both that the fraps times are consistent and the FCAT measures are consistent, they after all measure the input into the GPU and the output and we need both to get a true picture of the sub component.
Thus I am of the opinion your data doesn't currently show what you thought it did and your analysis needs work.
rscsrAT - Thursday, May 23, 2013 - link
As far as I understood the delta averaging, it adds the time difference between two adjacent frames.To make it clear, if you have 6 frames with 16/32/16/32/16/32ms per frame, you would calculate the value with (5*16)/((3*16+3*32)/6)=333%.
But if you have 6 framse with 16/16/16/32/32/32ms per frame, you would have 16/((3*16+3*32)/6)=67%.
Therefore you still have a higher value for a higher fluctuating framerate than with a steady framerate.
WeaselITB - Thursday, May 23, 2013 - link
For your #1 -- 95th percentile is a pretty common statistical analysis tool http://en.wikipedia.org/wiki/68-95-99.7_rule ... I'm assuming that they're assuming a normal distribution, which intuitively makes sense given that you'd expect most results to be close to the mean. I'd be interested in seeing the 3-sigma values, as that would further point out the extreme outliers, and would probably satisfy your desire for the "1%" as well.For your #2 -- they're measuring what you're describing, the differences between individual frametimes. Compare their graphs on the "Our First FCAT" page between the line graph of the frametimes of the cards and the bar graph after they massaged the data. The 7970GE has the smallest delta percentage, and the tightest line graph. The 7990 has the largest delta percentage (by far), and the line graph is all over the place. Their methodology of coming up with the "delta percentage" difference is sound.
-Weasel
jonjonjonj - Thursday, May 23, 2013 - link
amd get your act together so we have some competition. i really don't even see the point to this card at this price. what are they going to do for the 770? sell and even more crippled GK110 for $550? and the 760ti will be $450? or are they just going to sell the the 680 as a 770?