NVIDIA GeForce GTX 780 Review: The New High End
by Ryan Smith on May 23, 2013 9:00 AM ESTCompute
Jumping into compute, we should see a mix of results here, with some tests favoring the GK110 based GTX 780’s more compute capable design, while other tests will punish it for not being a fast FP64 card like GTX Titan.
As always we'll start with our DirectCompute game example, Civilization V, which uses DirectCompute to decompress textures on the fly. Civ V includes a sub-benchmark that exclusively tests the speed of their texture decompression algorithm by repeatedly decompressing the textures required for one of the game’s leader scenes. While DirectCompute is used in many games, this is one of the only games with a benchmark that can isolate the use of DirectCompute and its resulting performance.
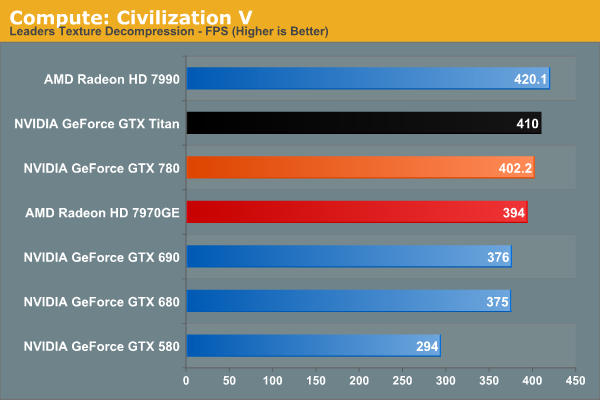
Civilization V’s DirectCompute performance is looking increasingly maxed out at the high end. At 402fps the GTX 780 may as well be tied with GTX Titan. On the other hand it’s a reminder that while we don’t always see NVIDIA do well in our more pure compute tests, it can deliver where it matters for games with DirectCompute.
Our next benchmark is LuxMark2.0, the official benchmark of SmallLuxGPU 2.0. SmallLuxGPU is an OpenCL accelerated ray tracer that is part of the larger LuxRender suite. Ray tracing has become a stronghold for GPUs in recent years as ray tracing maps well to GPU pipelines, allowing artists to render scenes much more quickly than with CPUs alone.
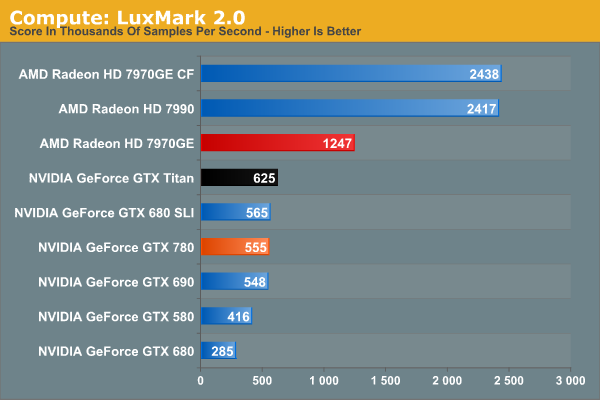
NVIDIA has never done well at LuxMark, and GTX 780 won’t change that. It’s greatly faster than GTX 680 and that’s about it. Kepler parts, including GK110, continue to have trouble with our OpenCL benchmarks, as evidenced by the fact that GTX 780 doesn’t beat GTX 580 by nearly as much as the generational improvements should lead to. GK110 is a strong compute GPU, but not in ways that LuxMark is going to benefit.
Our 3rd benchmark set comes from CLBenchmark 1.1. CLBenchmark contains a number of subtests; we’re focusing on the most practical of them, the computer vision test and the fluid simulation test. The former being a useful proxy for computer imaging tasks where systems are required to parse images and identify features (e.g. humans), while fluid simulations are common in professional graphics work and games alike.
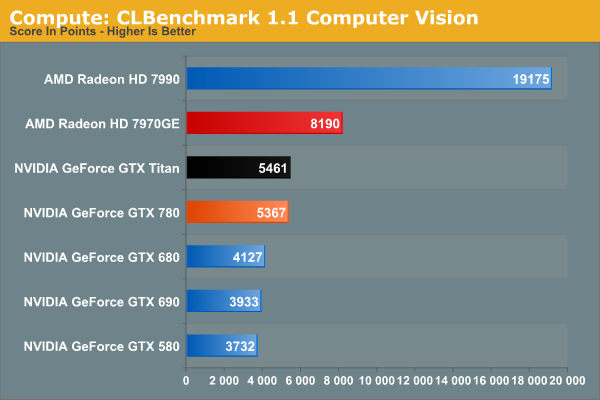
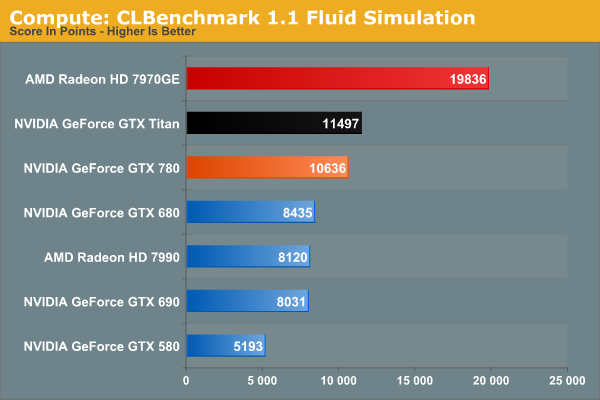
GTX 780 still struggles some at compute with CLBenchmark, but less so than with LuxMark. 7970GE is the clear winner here in both tests, while GTX 780 stays remarkably close to GTX Titan in performance. The fluid simulation in particular makes GTX 780 look good on a generational basis, more than doubling GTX 580’s performance.
Moving on, our 4th compute benchmark is FAHBench, the official Folding @ Home benchmark. Folding @ Home is the popular Stanford-backed research and distributed computing initiative that has work distributed to millions of volunteer computers over the internet, each of which is responsible for a tiny slice of a protein folding simulation. FAHBench can test both single precision and double precision floating point performance, with single precision being the most useful metric for most consumer cards due to their low double precision performance. Each precision has two modes, explicit and implicit, the difference being whether water atoms are included in the simulation, which adds quite a bit of work and overhead. This is another OpenCL test, as Folding @ Home has moved exclusively to OpenCL this year with FAHCore 17.
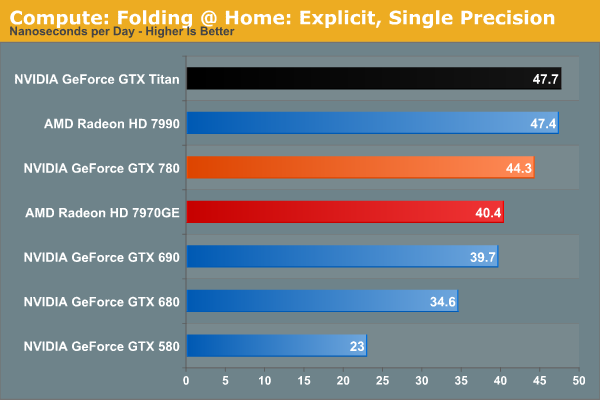
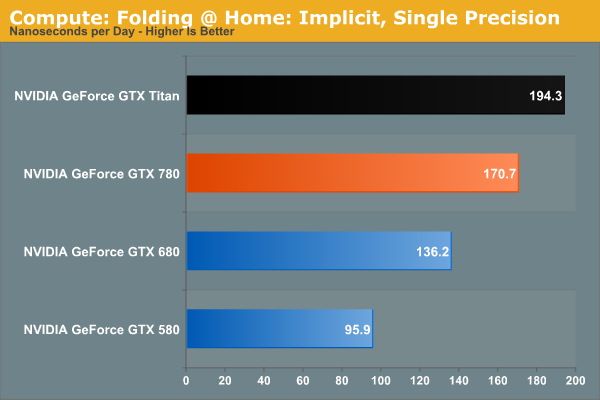
The Folding@Home group recently pushed out a major core update(FAHBench 1.2.0), which we’ve rerun on a number of cards and is reflected in our results. Unfortunately this version also broke single precision implicit on AMD GPUs and AMD’s latest drivers, so we only have NVIDIA GPUs for that section.
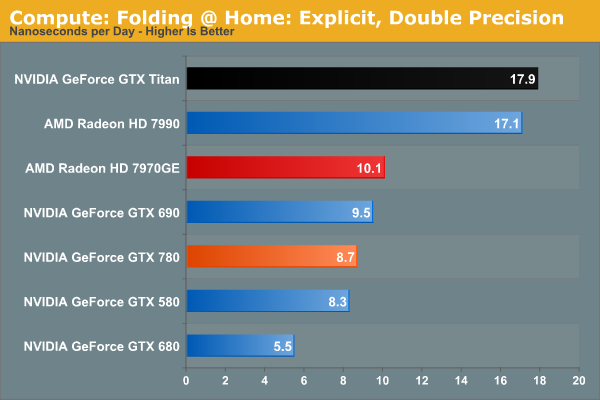
In any case, despite the fact that this is an OpenCL benchmark this is one of the cases where NVIDIA GPUs do well enough for themselves in single precision mode, with GTX 780 surpassing 7970GE, and falling behind only GTX Titan and the 7990. GTX 780 doesn’t necessarily benefit from GK110’s extra compute functionality, but it does see a performance improvement over GTX 680 that’s close to the theoretical difference in shader performance. Meanwhile in double precision mode, the lack of an uncapped double precision mode for GTX 780 means that it brings up the bottom of the charts compared to Titan and its 1/3 FP64 rate. Compute customers looking for a bargain NVIDIA card (relatively speaking) will need to stick with Titan.
Wrapping things up, our final compute benchmark is an in-house project developed by our very own Dr. Ian Cutress. SystemCompute is our first C++ AMP benchmark, utilizing Microsoft’s simple C++ extensions to allow the easy use of GPU computing in C++ programs. SystemCompute in turn is a collection of benchmarks for several different fundamental compute algorithms, as described in this previous article, with the final score represented in points. DirectCompute is the compute backend for C++ AMP on Windows, so this forms our other DirectCompute test.
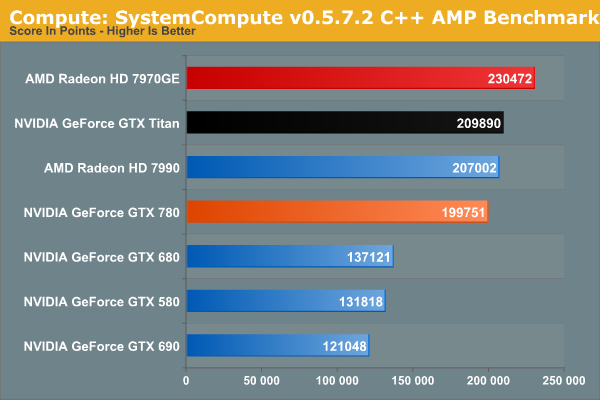
SystemCompute shows very clear gains over both the GTX 680 and GTX 580, while trailing the GTX Titan as expected. However like Titan, both trail the 7970GE.


155 Comments
View All Comments
just4U - Thursday, May 23, 2013 - link
I love the fact that their using the cooler they used for the Titan. While I plan to wait (no need to upgrade right now) I'd like to see more of that.. It's a feature I'd pay for from both Nvidia and Amd.HalloweenJack - Thursday, May 23, 2013 - link
no compute with the GTX 780 - the DP is similar to a GTX 480 and way way down on a 7970. no folding on these thenBiffaZ - Friday, May 24, 2013 - link
Folding doesn't use DP currently, its SP, same for most @home type compute apps, the main exclusion being Milkyway@Home which needs DP alot.boe - Thursday, May 23, 2013 - link
Bring on the DirectCU version and I'll order 2 today!slickr - Thursday, May 23, 2013 - link
At $650 its way too expensive. Two years ago this card would have been $500 at launch and within 4-5 months it would have been $400 with the slower cut down version at $300 and mid range cards $200.I hope people aren't stupid to buy this overpriced card that only brings about 5fps more than AMD top end single card.
chizow - Thursday, May 23, 2013 - link
I think if it launched last year, it's price would have been more justified, but Nvidia sat on it for a year while they propped up mid-range GK104 as flagship. Very disappointing.Measured on it's own merits, GTX 780 is very impressive and probably worth the increase over previous flagship price points. For example, it's generally 80% faster than GTX 580, almost 100% faster than GTX 480, it's predecessors. In the past the increase might only be ~60-75% and improve some with driver gains. It also adds some bling and improvements with the cooler.
It's just too late imo for Nvidia to ask those kinds of prices, especially after lying to their fanbase about GK104 always slotted as Kepler flagship.
JPForums - Thursday, May 23, 2013 - link
I love what you are doing with frame time deltas. Some sites don't quite seem to understand that you can maintain low maximum frame times while still introducing stutter (especially in the simulation time counter) by having large deltas between frames. In the worst case, your simulation time can slow down (or speed up) while your frame time moves back in the opposite direction exaggerating the result.Admittedly I may be misunderstanding your method as I'm much more accustomed to seeing algebraic equations describing the method, but assuming I get it, I'd like to suggest further modification to you method to deal with performance swings that occur expectedly (transition to/from cut-scenes, arrival/departure of graphically intense elements, etc.). Rather than compare the average of the delta between frames against an average frame time across the entire run, you could compare instantaneous frame time against a sliding window average. The window could be large for games with consistent performance and smaller for games with mood swings. Using percentages when comparing against the average frame times for the entire run can result in situations where two graphics solutions with the exact same deltas would show the one with better performance having worse deltas. As an example, take any video cards frame time graph and subtract 5ms from each frame time and compare the two resulting delta percentages. A sliding window accounts for natural performance deviations while still giving a baseline to compare frame times swings from. If you are dead set on percentages, you can take them from there as the delta percentages from local frame time averages are more relevant than the delta percentage from the runs overall average. Given my love of number manipulation, though, I'd still prefer to see the absolute frame time difference from the sliding window average. It would make it much easier for me to see whether the difference to the windowed average is large (lets say >15ms) or small (say <4ms). Of course, while I'm being demanding, it would be nice to get an xls, csv, or some other format of file with the absolute frame times so I can run whatever graph I want to see myself. I won't hold my breath. Take some of my suggestions, all of them, or none of them. I'm just happy to see where things are going.
Arnulf - Thursday, May 23, 2013 - link
The correct metric for this comparison would be die size (area) and complexity of manufacturing rather than the number of transistors.RAM modules contain far more transistors (at least a couple of transistors per bit, with common 4 GB = 32 Gb = 64+ billion transistors per stick modules selling for less than $30 on Newegg), yet cost peanuts compared to this overpriced abomination that is 780.
marc1000 - Thursday, May 23, 2013 - link
and GTX 760 ??? what will it be? will it be $200??or maybe the 660 will be rebranded as 750 and go to $150??
kilkennycat - Thursday, May 23, 2013 - link
Fyi: eVGA offers "Superclocked" versions of the GTX780 with either a eVGA-designed "ACX" dual-open-fan cooler, or the nVidia-designed "titan"blower. Both at $659 are ~ $10 more than the default-speed version. The overclocks are quite substantial, 941MHz base, 993MHz boost (vs default 863/902) for the "titan" blower version, 967/1020 for the ACX-cooler version. The ACX cooler is likely to be more noisy than the "titan", plus it will dump some exhaust heat back into the computer case. Both of these eVGa Superclocked types were available for a short time on Newegg this morning, now "Auto Notify" :-( :-(