The Seagate 600 & 600 Pro SSD Review
by Anand Lal Shimpi on May 7, 2013 8:00 AM ESTRandom Read/Write Speed
The four corners of SSD performance are as follows: random read, random write, sequential read and sequential write speed. Random accesses are generally small in size, while sequential accesses tend to be larger and thus we have the four Iometer tests we use in all of our reviews.
Our first test writes 4KB in a completely random pattern over an 8GB space of the drive to simulate the sort of random access that you'd see on an OS drive (even this is more stressful than a normal desktop user would see). I perform three concurrent IOs and run the test for 3 minutes. The results reported are in average MB/s over the entire time. We use both standard pseudo randomly generated data for each write as well as fully random data to show you both the maximum and minimum performance offered by SandForce based drives in these tests. The average performance of SF drives will likely be somewhere in between the two values for each drive you see in the graphs. For an understanding of why this matters, read our original SandForce article.
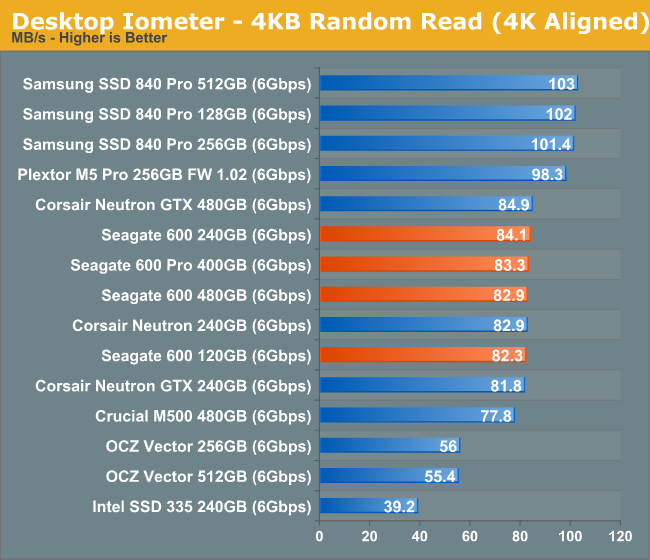
Random read performance is consistent across all capacity points. Performance here isn't as high as what Samsung is capable of achieving but it is very good.
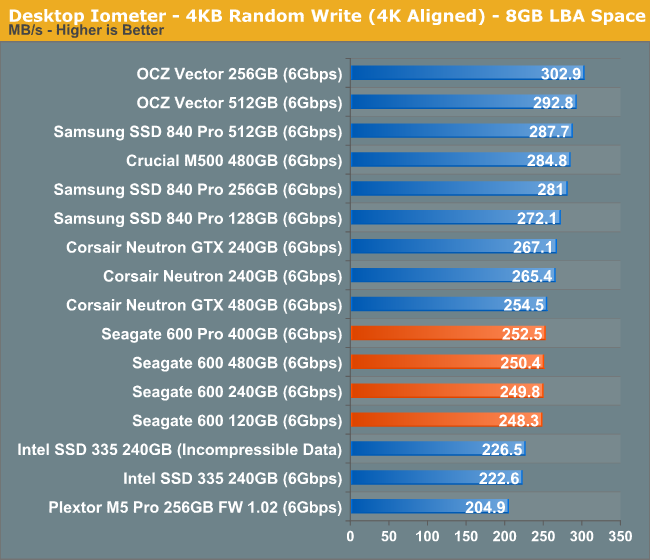
Low queue depth random write performance has just gotten insanely high on client drives over the past couple of years. Seagate doesn't lead the pack with the 600 but it does good enough. Note the lack of any real difference between the capacities in terms of performance.
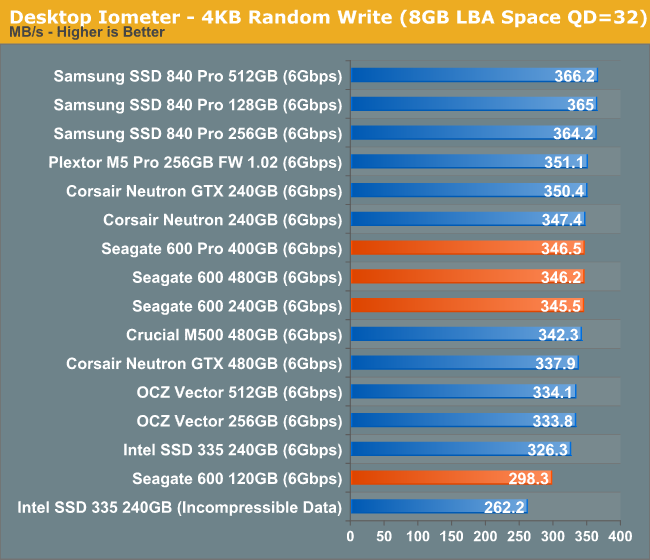
Ramp up queue depth and we see a small gap between the 120GB capacity and the rest. The 600/600 Pro climb the charts a bit at higher queue depths. Note the lack of any performance difference between the 600 and 600 Pro at similar capacities.
Sequential Read/Write Speed
To measure sequential performance I ran a 1 minute long 128KB sequential test over the entire span of the drive at a queue depth of 1. The results reported are in average MB/s over the entire test length.
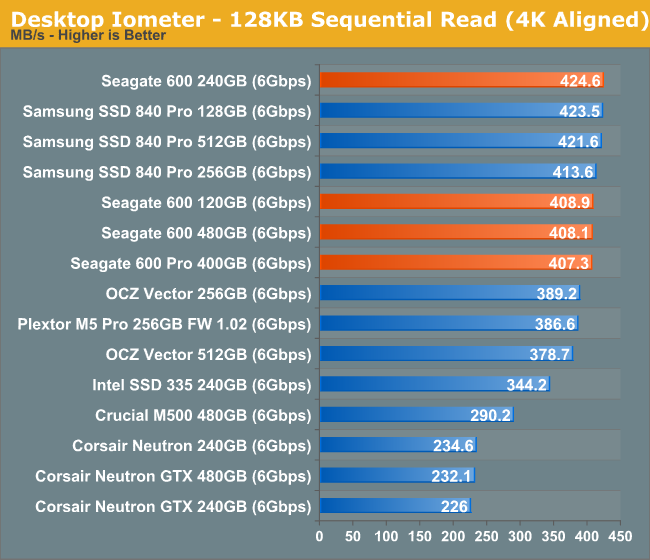
Here's how you tell that Seagate has client drive experience: incredible low queue depth sequential read performance. I'm not sure why the 240GB 600 does so well here, but for the most part all of the drives are clustered around the same values.
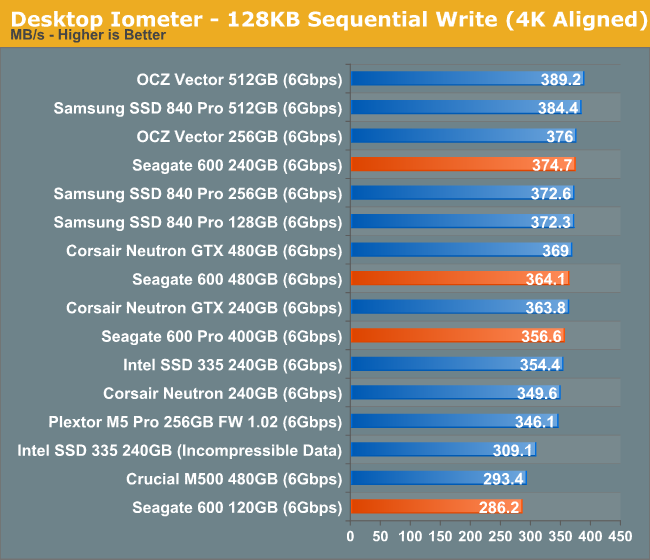
Low queue depth sequential writes are also good. The 240GB capacity does better than the rest for some reason. Only the 120GB capacity shows any sign of weakness compared to other class leaders.
AS-SSD Incompressible Sequential Read/Write Performance
The AS-SSD sequential benchmark uses incompressible data for all of its transfers. The result is a pretty big reduction in sequential write speed on SandForce based controllers.
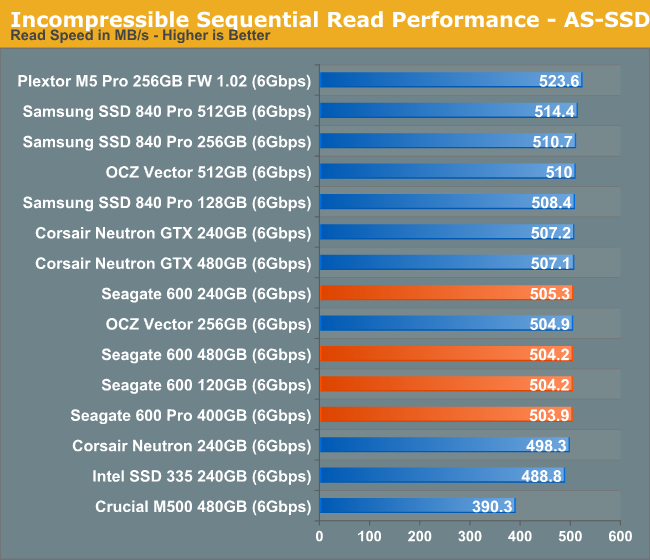
On the read side, at high queue depths we're pretty much saturating 6Gbps SATA at this point. The fastest drive here only holds a 3% advantage over the 600s.
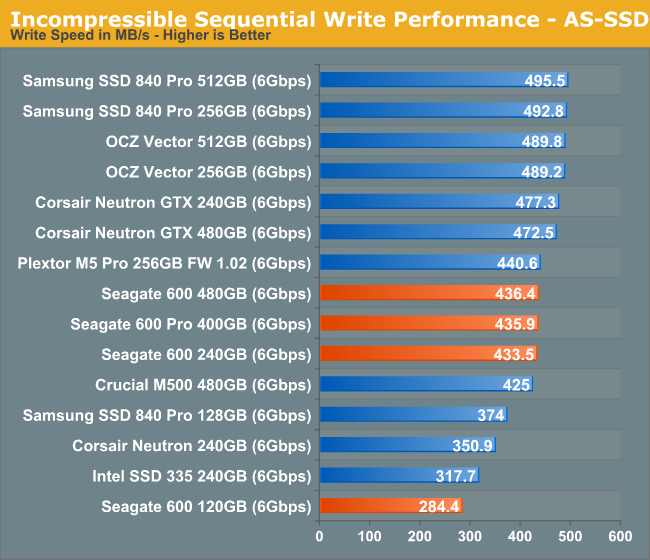
Once again we see solid performance from the 600s. There's no performance advantage to the Pro, and the 120GB capacity is measurably slower.


59 Comments
View All Comments
Jestre - Tuesday, May 7, 2013 - link
2 requests:Can you incorporate the average power usage measured during the testing benchmarks, both "the Destroyer" and the 2011 benchmarks?
It would be nice to see the actual realistic measured power consumption averages for worst case tests like this. You could also list an average power with a reasonable downtime calculated based on a typical usage pattern and the actual time to complete.
Can you also list the time is take to complete these test for each drive,
Thanks for all you good work.
Jestre
Kristian Vättö - Tuesday, May 7, 2013 - link
At least I don't have the hardware for measuring power consumption over time (all I have is a simple multimeter, unless it has features I'm not aware of). Anand might but I'm guessing not as I'm sure he would have taken advantage of it. The problem is that such hardware is not exactly cheap, so it's a rather big investment for only one test (I'd love to have one though).lotharamious - Tuesday, May 7, 2013 - link
Another wonderful SSD review, Anand. Well done!Since I started reading your site over 11 years ago your reviews have been really outstanding and particularly so with SSDs.
I really love delving into the data presented, but you guys really need to get with the times on data plotting. Your charts can be somewhat confusing and downright frustrating to read.
When showing scatter plots please include an option for plotting more statistics of the dataset, e.g. trendline about the mean, standard deviation, etc. It's really difficult to see just how well the 800 is gaining performance towards the end of the test run without a noticable trendline for your eyes to follow along the graph.
In a chart, when displaying a line that corresponds to the unit that is currently being reviewed please draw that line ON TOP of the other references units' data lines. It's frustrating to try to compare the performance of different units when the one you really care about is blocked from view because the other 50 lines on the chart make a large enough noisy mess to not be able to tell right from left.
And just for fun, I really wish you guys used a javascript plotting library for your reviews. It would be awesome if you could click on different graphics cards in a graph to see the percentage performance gain you would get between the card you clicked on and all the other cards in the graph. I've seen this kind of stuff on other sites, and it would be amazing to have here.
Sorry for being so negative, because I still love reading this site every day. It's been incredible to see how you, the industry, and the drives themselves have morphed since 2008.
Here's to many more great reviews!
mike55 - Tuesday, May 7, 2013 - link
What causes the sharp drop in IOPS in the random write tests after so many minutes for SSDs? Is it because the drive has run out of empty blocks and is then doing read-modify-writes?mike55 - Tuesday, May 7, 2013 - link
Never mind, just realized my question was answered in the article.HisDivineOrder - Tuesday, May 7, 2013 - link
I imagine Seagate will tap its longterm partner, Samsung, to help it out with SSD controllers once LAMD is gone. Who did Samsung sell its hard drive business to? Seagate.Who did Seagate contract out for NAND from? Samsung.
Seagate'll go back to Samsung once it's time for a new controller that can handle SATAe.
kyuu - Wednesday, May 8, 2013 - link
While this is a decent drive, another source revealed that Seagate is trying to pull warranty shenanigans, limiting the warranty to 3 years OR 72 TB of writes (36 TB for the smaller drives), whichever comes first. Putting a "mileage" limit on the warranty is a first in the SSD space as far as I'm aware, and not something that should be supported. Definite pass on Seagate's SSDs unless and until they change their warranty terms.Kristian Vättö - Wednesday, May 8, 2013 - link
If you look at the warranty terms of other manufacturers, there is always a phrase that says warranty is invalidated if the SSD is operated outside of public specifications (and endurance is one one of them):Intel: "any Product which has been modified or operated outside of Intel’s publicly available
specifications"
http://download.intel.com/support/ssdc/hpssd/sb/1s...
Crucial: "The above warranties cover only defects arising under normal use and do not include malfunctions or failures resulting from misuse, abuse, neglect, alteration, problems with electrical power, usage not in accordance with product instructions"
http://www.crucial.com/company/termsofsale.aspx#li...
OCZ: "Improper use of product, Normal wear and tear"
http://ocz.com/consumer/support/warranty
Or at least that's how I interpret their warranties. In a nutshell, warranty only covers failures which are results of defects in materials or assembly - it's clear that endurance is limited and hence exceeding the specification means that a failure may not have been due to a defect.
daniel_mayes - Wednesday, May 8, 2013 - link
I would like to see consumer vs enterprise in a SMB server. Under a certain price point for example at $1,300 and lower you can get 3 x Intel 710 Series 100GB ($1,200), 5 x Intel DC S3700 100GB ($1,250), 4 x Seagate 600 Pro ($1,300), 5 x OCZ Vector 256 GB ($1,225), 5 x Corsair Neutron GTX 240 GB ($1,100), 5 x Samsung 840 Pro 256 GB ($1,200). Size doesn't matter as much as low latency and highest consistent performance. Since the consumer drives have more space over provision them at 25% and %50. That way we can see if more consumer ssd's at a higher provision rate are faster in a SMB environment than the enterprise drives. Yes I know the consumer ssd's will probably die faster but I'm sure most SMB's would rather pay half the cost of an enterprise drive and chance having to replace it twice as often.Jestre - Wednesday, May 8, 2013 - link
Kristian,is $59.95 with free shipping in your budget?
See http://www.rc-electronics-usa.com/ammeters/dc-amp-...
Not a sweet and an Agilent EPM power meter but it should do the trick at 3% of the price.
Jestre .