The Crucial/Micron M500 Review (960GB, 480GB, 240GB, 120GB)
by Anand Lal Shimpi on April 9, 2013 9:59 AM ESTRandom Read/Write Speed
The four corners of SSD performance are as follows: random read, random write, sequential read and sequential write speed. Random accesses are generally small in size, while sequential accesses tend to be larger and thus we have the four Iometer tests we use in all of our reviews.
Our first test writes 4KB in a completely random pattern over an 8GB space of the drive to simulate the sort of random access that you'd see on an OS drive (even this is more stressful than a normal desktop user would see). I perform three concurrent IOs and run the test for 3 minutes. The results reported are in average MB/s over the entire time. We use both standard pseudo randomly generated data for each write as well as fully random data to show you both the maximum and minimum performance offered by SandForce based drives in these tests. The average performance of SF drives will likely be somewhere in between the two values for each drive you see in the graphs. For an understanding of why this matters, read our original SandForce article.
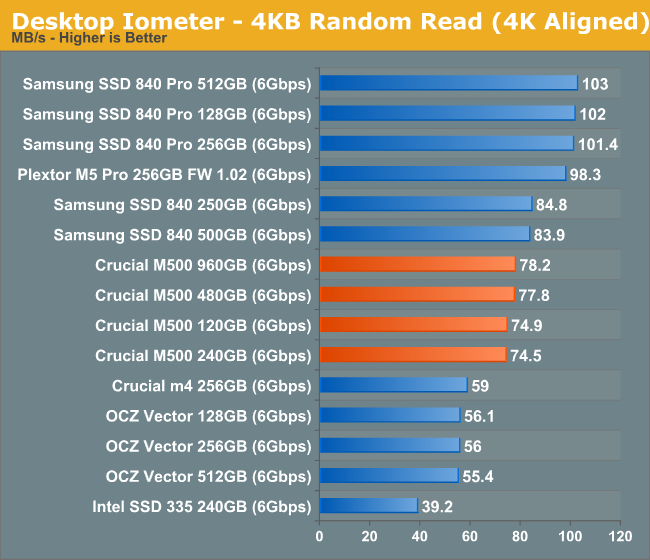
Random read performance starts out quite nicely. There's a good improvement over the old m4 and the M500 lineup finds itself hot on the heels of the Samsung SSD 840. There's not much variance between the various capacities here.
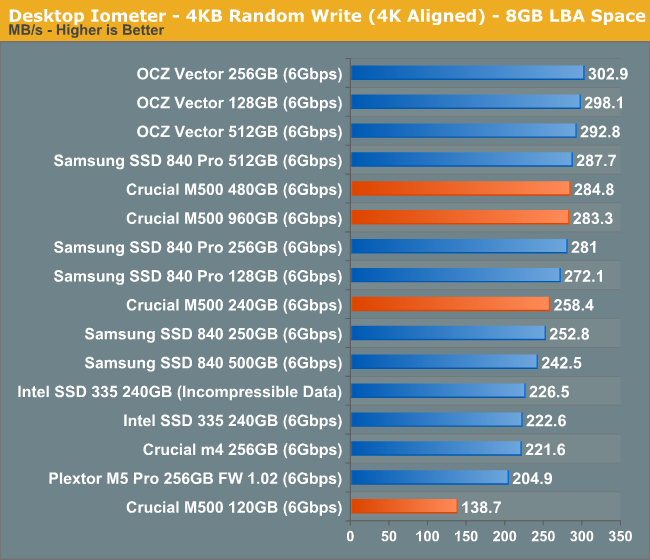
It's with the random write performance that we get some insight into how write parallelism works on the M500. The 480GB and 960GB drives deliver roughly the same performance, so all you really need to saturate the 9187 is 32 NAND die. The 240GB sees a slight drop in performance, but the 120GB version with only 8 NAND die sees the biggest performance drop. This is exactly why we don't see a 64GB M500 at launch using 128Gbit die.
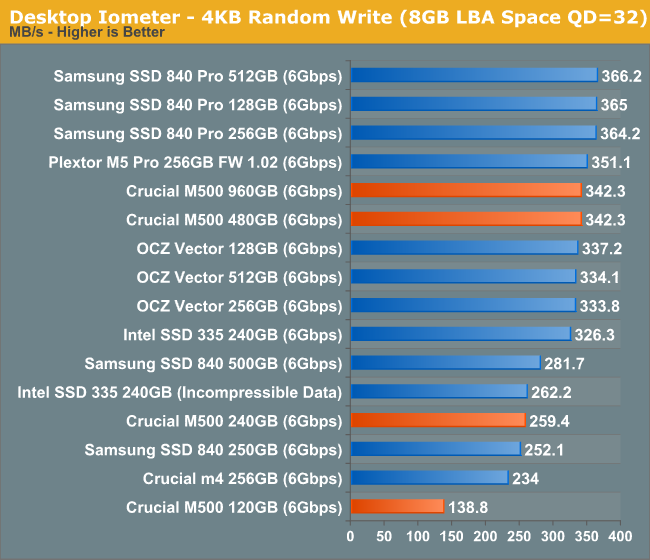
Ramping up queue depth causes some extra scaling on the 32/64 die drives, but the 240GB and 120GB parts are already at their limits. There physically aren't enough NAND die to see any tangible gains in performance between high and low queue depths here on the smaller drives. This is going to be a problem that everyone will have to deal with ultimately, the M500 just encounters it first.
Sequential Read/Write Speed
To measure sequential performance I ran a 1 minute long 128KB sequential test over the entire span of the drive at a queue depth of 1. The results reported are in average MB/s over the entire test length.
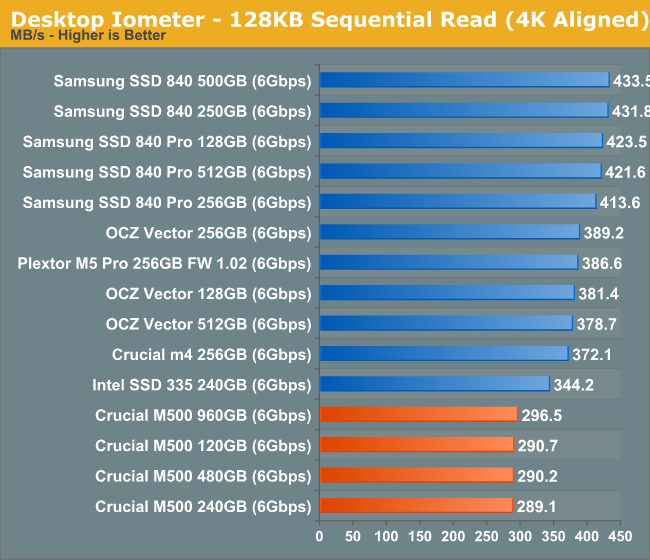
Low queue depth sequential read performance looks ok but the M500 is definitely not class leading here.
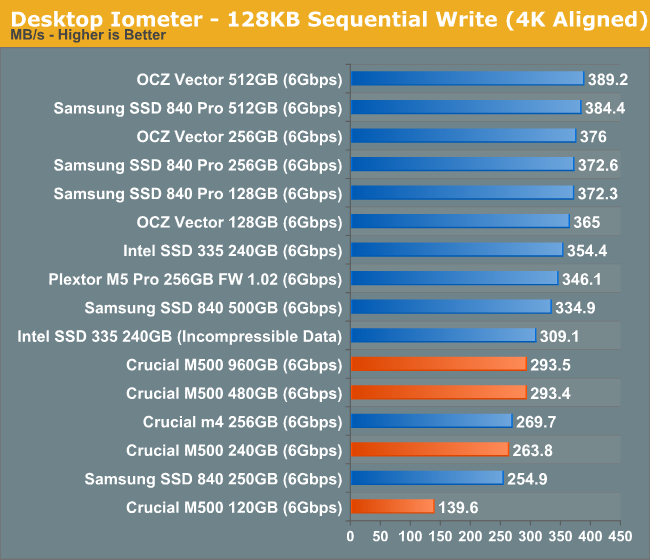
There's pretty much the same story when we look at sequential writes, although once again the 120GB M500 shows its limits very openly. The 840 and M500 have similar performance levels at the same capacity point, but the M500 is significantly behind the higher end offerings as you'd expect.
AS-SSD Incompressible Sequential Read/Write Performance
The AS-SSD sequential benchmark uses incompressible data for all of its transfers. The result is a pretty big reduction in sequential write speed on SandForce based controllers.
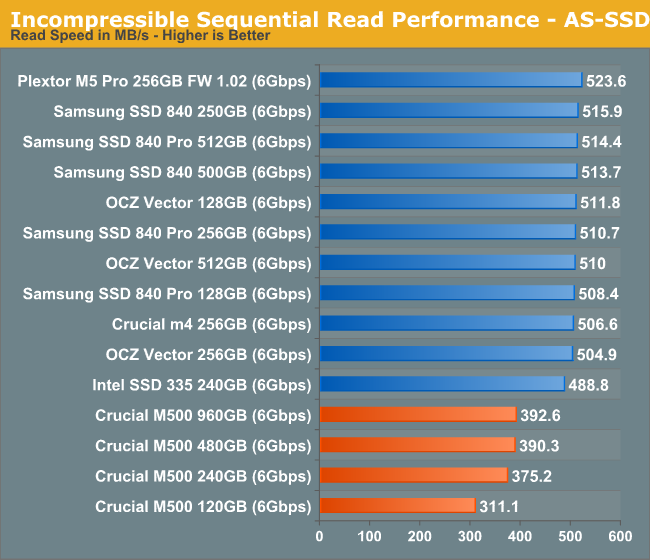
Ramping up queue depth we see a substantial increase in sequential read performance, but there's still a big delta between the M500 and all of the earlier drives.
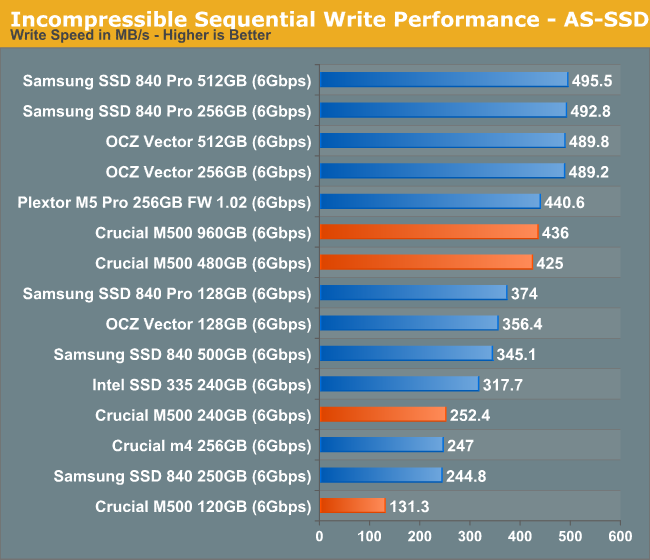
The high-queue depth sequential write story is a bit better for the M500. It's tangibly quicker than the 840 here.


111 Comments
View All Comments
Crazy1 - Tuesday, April 9, 2013 - link
Using the 2012 charts from Tom's Hardware I was able to compile some numbers between the 840 pro and popular mobile HDDs. While not a comprehensive comparison, these numbers are coming from a single source, so they should be reliable enough to provide a general understanding that there is a power savings when using an SSD instead of an HDD. These are the average power consumption numbers during the following workloads.------------------------------------idle----------video playback---------Database-
840Pro 128GB 0.03W 0.4W 1.2W
840Pro 256GB 0.03W 0.5W 1.4W
840Pro 512GB 0.04W 0.6W 1.5W
WD blue 500GB 0.36W 0.94W 2.2W
WD blue 1TB 0.6W 1.1W 1.9W
WD black 750GB 0.9W 1.4W 2.4W
Seagate XT 750GB* 0.8W 2.1W 2.6W
* The XT 750GB is running sata III. The XT 500GB running sata II gives power numbers closer to the two WD Blue drives.
It's fairly clear from these numbers that the 840pro uses less power than mobile HDD's. This isn't true for all SSD's though. Some of the Sandforce-based SSDs result in similar average wattage numbers as WD Blue drives. Those SSDs are still more power efficient because they have a better performance-per-watt ratio.
Crazy1 - Tuesday, April 9, 2013 - link
My table was ruined. Hopefully this is easier to read.------------------------------------idle----------video playback---------Database-
840Pro 128GB _______0.03W ________0.4W__________ 1.2W
840Pro 256GB _______0.03W ________0.5W __________1.4W
840Pro 512GB _______0.04W ________0.6W __________1.5W
WD blue 500GB ______0.36W ________0.94W _________2.2W
WD blue 1TB ________ 0.6W _________1.1W __________1.9W
WD black 750GB _____0.9W _________1.4W __________2.4W
Seagate XT 750GB*___0.8W _________2.1W __________2.6W
vol7ron - Monday, December 9, 2013 - link
Take it to the forumsleexgx - Tuesday, July 1, 2014 - link
personally do not trust TW site but SSDs do use less power then an HDD over the same time (say 10-30 seconds) Peak power on some SSDs mite be higher then an laptop HDD but that be for an extreme short times so a SSD will be idle for most of the time where as HDD is very likely going to be still be active reading due to its Slow random access speeds (Writes normally but your typical laptop is mostly reads, HDDs reads and writes are about the same power wise)Wolfpup - Monday, April 15, 2013 - link
Yeah, SSDs don't automatically use less power than mechanical drives...and for that matter aren't automatically more reliable either.Arkive - Tuesday, April 9, 2013 - link
"Bang for the buck" depends entirely on how much storage you need and it's use-case.UltraTech79 - Saturday, April 13, 2013 - link
Did you just want to be the guy that made a shocking statement or something? Even if its totally fucking false? SSD wont be better bang for the buck for at least another two generations, probably three.And everyone discussing power req. is amusing. We are talking about fractions of cents, people, and if you think that adds up somehow in a server environment, you forgot to 'add up' the fact that these will not last even half as long as a enterprise quality HDD/SDD, so your going to have to replace them at least once. Bang for the buck? Bullshit. What these things are, are awesome fast preforming little pieces of amazing - but you will pay for it, get real.
leexgx - Tuesday, July 1, 2014 - link
he was talking about laptop hdds,but still mostly incorrect as Most SSDs idle at under 0.1w where an SSD will be at for most of its life (assuming consumer laptop, not server or workstation loads)mutantmagnet - Wednesday, April 17, 2013 - link
SSDs are dramatically more vulnerable to brown outs and power surges than mechanical drives. This SSD's price point made me consider briefly I could forgo hard drives completely but SSDs aren't quite there yet.leexgx - Tuesday, July 1, 2014 - link
interesting (bit of old post to reply to) an SSD dieing to a power surge, i would resolve your issue first