The Crucial/Micron M500 Review (960GB, 480GB, 240GB, 120GB)
by Anand Lal Shimpi on April 9, 2013 9:59 AM ESTA Preview of The Destroyer, Our 2013 Storage Bench
When I built the AnandTech Heavy and Light Storage Bench suites in 2011 I did so because we didn't have any good tools at the time that would begin to stress a drive's garbage collection routines. Once all blocks have a sufficient number of used pages, all further writes will inevitably trigger some sort of garbage collection/block recycling algorithm. Our Heavy 2011 test in particular was designed to do just this. By hitting the test SSD with a large enough and write intensive enough workload, we could ensure that some amount of GC would happen.
There were a couple of issues with our 2011 tests that I've been wanting to rectify however. First off, all of our 2011 tests were built using Windows 7 x64 pre-SP1, which meant there were potentially some 4K alignment issues that wouldn't exist had we built the trace on a system with SP1. This didn't really impact most SSDs but it proved to be a problem with some hard drives. Secondly, and more recently, I've shifted focus from simply triggering GC routines to really looking at worst case scenario performance after prolonged random IO. For years I'd felt the negative impacts of inconsistent IO performance with all SSDs, but until the S3700 showed up I didn't think to actually measure and visualize IO consistency. The problem with our IO consistency tests are they are very focused on 4KB random writes at high queue depths and full LBA spans, not exactly a real world client usage model. The aspects of SSD architecture that those tests stress however are very important, and none of our existing tests were doing a good job of quantifying that.

I needed an updated heavy test, one that dealt with an even larger set of data and one that somehow incorporated IO consistency into its metrics. I think I've come up with the test, but given the short timeframe for this review (I only got my M500 drives a few days ago) I couldn't get a ton of data ready for you all today. The new benchmark doesn't even have a name, I've just been calling it The Destroyer (although AnandTech Storage Bench 2013 is likely a better fit for PR reasons).
Everything about this new test is bigger and better. The test platform moves to Windows 8 Pro x64. The workload is far more realistic. Just as before, this is an application trace based test - I record all IO requests made to a test system, then play them back on the drive I'm measuring and run statistical analysis on the drive's responses.
Imitating most modern benchmarks I crafted the Destroyer out of a series of scenarios. For this benchmark I focused heavily on Photo editing, Gaming, Virtualization, General Productivity, Video Playback and Application Development. Rough descriptions of the various scenarios are in the table below:
| AnandTech Storage Bench 2013 Preview - The Destroyer | ||||||||||||
| Workload | Description | Applications Used | ||||||||||
| Photo Sync/Editing | Import images, edit, export | Adobe Photoshop CS6, Adobe Lightroom 4, Dropbox | ||||||||||
| Gaming | Download/install games, play games | Steam, Deus Ex, Skyrim, Starcraft 2, BioShock Infinite | ||||||||||
| Virtualization | Run/manage VM, use general apps inside VM | VirtualBox | ||||||||||
| General Productivity | Browse the web, manage local email, copy files, encrypt/decrypt files, backup system, download content, virus/malware scan | Chrome, IE10, Outlook, Windows 8, AxCrypt, uTorrent, AdAware | ||||||||||
| Video Playback | Copy and watch movies | Windows 8 | ||||||||||
| Application Development | Compile projects, check out code, download code samples | Visual Studio 2012 | ||||||||||
While some tasks remained independent, many were stitched together (e.g. system backups would take place while other scenarios were taking place). The overall stats give some justification to what I've been calling this test internally:
| AnandTech Storage Bench 2013 Preview - The Destroyer, Specs | |||||||||||||
| The Destroyer (2013) | Heavy 2011 | ||||||||||||
| Reads | 38.83 million | 2.17 million | |||||||||||
| Writes | 10.98 million | 1.78 million | |||||||||||
| Total IO Operations | 49.8 million | 3.99 million | |||||||||||
| Total GB Read | 1583.02 GB | 48.63 GB | |||||||||||
| Total GB Written | 875.62 GB | 106.32 GB | |||||||||||
| Average Queue Depth | ~5.5 | ~4.6 | |||||||||||
| Focus | Worst case multitasking, IO consistency | Peak IO, basic GC routines | |||||||||||
SSDs have grown in their performance abilities over the years, so I wanted a new test that could really push high queue depths at times. The average queue depth is still realistic for a client workload, but the Destroyer has some very demanding peaks. When I first introduced the Heavy 2011 test, some drives would take multiple hours to complete it - today most high performance SSDs can finish the test in under 90 minutes. The Destroyer? So far the fastest I've seen it go is 10 hours. Most high performance I've tested seem to need around 12 - 13 hours per run, with mainstream drives taking closer to 24 hours. The read/write balance is also a lot more realistic than in the Heavy 2011 test. Back in 2011 I just needed something that had a ton of writes so I could start separating the good from the bad. Now that the drives have matured, I felt a test that was a bit more balanced would be a better idea.
Despite the balance recalibration, there's just a ton of data moving around in this test. Ultimately the sheer volume of data here and the fact that there's a good amount of random IO courtesy of all of the multitasking (e.g. background VM work, background photo exports/syncs, etc...) makes the Destroyer do a far better job of giving credit for performance consistency than the old Heavy 2011 test. Both tests are valid, they just stress/showcase different things. As the days of begging for better random IO performance and basic GC intelligence are over, I wanted a test that would give me a bit more of what I'm interested in these days. As I mentioned in the S3700 review - having good worst case IO performance and consistency matters just as much to client users as it does to enterprise users.
Given the sheer amount of time it takes to run through the Destroyer, and the fact that the test was only completed a little over a week ago, I don't have many results to share. I'll be populating this database over the coming weeks/months. I'm still hunting for any issues/weirdness with the test so I'm not ready to remove the "Preview" label from it just yet. But the results thus far are very telling.
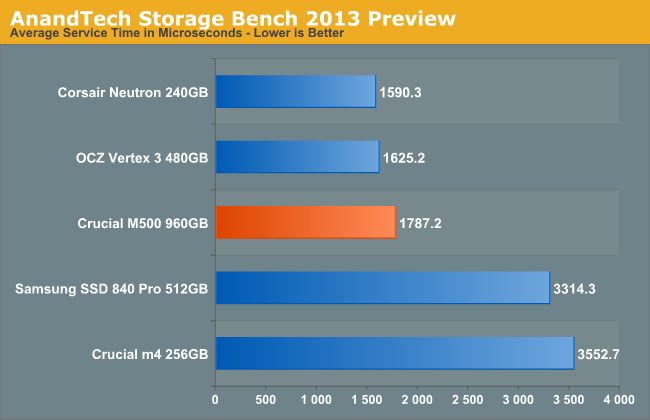
I'm reporting two primary metrics with the Destroyer: average data rate in MB/s and average service time in microseconds. The former gives you an idea of the throughput of the drive during the time that it was running the Destroyer workload. This can be a very good indication of overall performance. What average data rate doesn't do a good job of is taking into account response time of very bursty (read: high queue depth) IO. By reporting average service time we heavily weigh latency for queued IOs. You'll note that this is a metric I've been reporting in our enterprise benchmarks for a while now. With the client tests maturing, the time was right for a little convergence.
I'll also report standard deviation for service times to give you some idea of IO consistency.
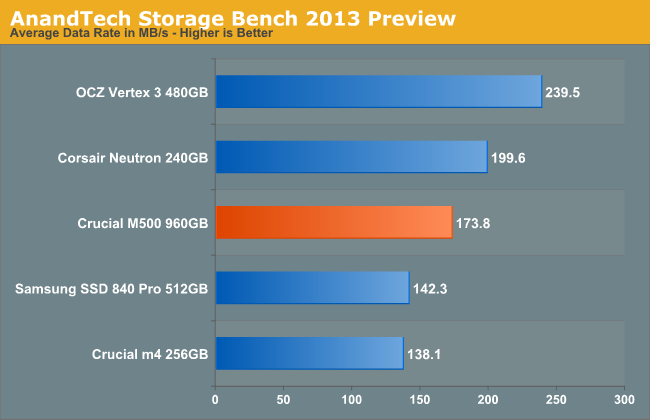
Average data rates already show us something very surprising. The Corsair Neutron, which definitely places below Samsung's SSD 840 Pro in our Heavy 2011 test, takes second place here. If you look at the IO consistency graphs from the previous page however, this shouldn't come as a huge shock. Without additional spare area, the 840 Pro can definitely back itself into a corner - very similar to the old m4 in fact. The M500 dramatically improves IO consistency and worst case scenario IO performance, and it shows.
The SF-2281 based Vertex 3 does extremely well, taking the crown. SandForce's real time compression/de-dupe engine has always given it wonderful performance, even when running these heavy workloads as long as there's some portion of data that's compressible. The problem with SandForce wasn't performance, it was always a reliability concern that drove us elsewhere.
The results are echoed here, and exaggerated quite significantly. The SF-2281 based Vertex 3 does very well as it's able to work as if it has more spare area thanks to the fact that some of the workload can be compressed in real time. I did fill all drives with incompressible data at first, but given that not all parts of the workload are incompressible the SandForce drive gets a bit of an advantage - similar to what would happen in the real world.
Note that the Vertex 3 and Neutron swap spots as we look at average service time. This is exactly what I was talking about earlier. Here we're looking more at how a drive handles bursty (high queue depth) workloads vs. overall performance in our suite. Both metrics are important, but this one is likely more relevant to how fast your system feels.
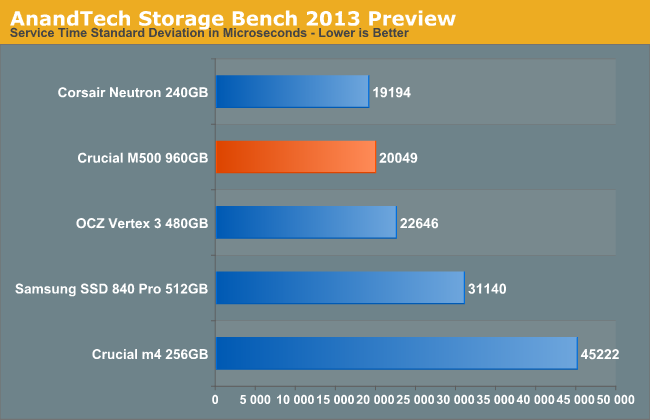
Although the Neutron clearly has the response time advantage, the M500 delivers a remarkably competitive consistency story. Absolute performance may not be great in its lowest performing state, but the M500 keeps things consistent. Comparing to the old m4 we see just how bad things used to be.


111 Comments
View All Comments
Crazy1 - Tuesday, April 9, 2013 - link
Using the 2012 charts from Tom's Hardware I was able to compile some numbers between the 840 pro and popular mobile HDDs. While not a comprehensive comparison, these numbers are coming from a single source, so they should be reliable enough to provide a general understanding that there is a power savings when using an SSD instead of an HDD. These are the average power consumption numbers during the following workloads.------------------------------------idle----------video playback---------Database-
840Pro 128GB 0.03W 0.4W 1.2W
840Pro 256GB 0.03W 0.5W 1.4W
840Pro 512GB 0.04W 0.6W 1.5W
WD blue 500GB 0.36W 0.94W 2.2W
WD blue 1TB 0.6W 1.1W 1.9W
WD black 750GB 0.9W 1.4W 2.4W
Seagate XT 750GB* 0.8W 2.1W 2.6W
* The XT 750GB is running sata III. The XT 500GB running sata II gives power numbers closer to the two WD Blue drives.
It's fairly clear from these numbers that the 840pro uses less power than mobile HDD's. This isn't true for all SSD's though. Some of the Sandforce-based SSDs result in similar average wattage numbers as WD Blue drives. Those SSDs are still more power efficient because they have a better performance-per-watt ratio.
Crazy1 - Tuesday, April 9, 2013 - link
My table was ruined. Hopefully this is easier to read.------------------------------------idle----------video playback---------Database-
840Pro 128GB _______0.03W ________0.4W__________ 1.2W
840Pro 256GB _______0.03W ________0.5W __________1.4W
840Pro 512GB _______0.04W ________0.6W __________1.5W
WD blue 500GB ______0.36W ________0.94W _________2.2W
WD blue 1TB ________ 0.6W _________1.1W __________1.9W
WD black 750GB _____0.9W _________1.4W __________2.4W
Seagate XT 750GB*___0.8W _________2.1W __________2.6W
vol7ron - Monday, December 9, 2013 - link
Take it to the forumsleexgx - Tuesday, July 1, 2014 - link
personally do not trust TW site but SSDs do use less power then an HDD over the same time (say 10-30 seconds) Peak power on some SSDs mite be higher then an laptop HDD but that be for an extreme short times so a SSD will be idle for most of the time where as HDD is very likely going to be still be active reading due to its Slow random access speeds (Writes normally but your typical laptop is mostly reads, HDDs reads and writes are about the same power wise)Wolfpup - Monday, April 15, 2013 - link
Yeah, SSDs don't automatically use less power than mechanical drives...and for that matter aren't automatically more reliable either.Arkive - Tuesday, April 9, 2013 - link
"Bang for the buck" depends entirely on how much storage you need and it's use-case.UltraTech79 - Saturday, April 13, 2013 - link
Did you just want to be the guy that made a shocking statement or something? Even if its totally fucking false? SSD wont be better bang for the buck for at least another two generations, probably three.And everyone discussing power req. is amusing. We are talking about fractions of cents, people, and if you think that adds up somehow in a server environment, you forgot to 'add up' the fact that these will not last even half as long as a enterprise quality HDD/SDD, so your going to have to replace them at least once. Bang for the buck? Bullshit. What these things are, are awesome fast preforming little pieces of amazing - but you will pay for it, get real.
leexgx - Tuesday, July 1, 2014 - link
he was talking about laptop hdds,but still mostly incorrect as Most SSDs idle at under 0.1w where an SSD will be at for most of its life (assuming consumer laptop, not server or workstation loads)mutantmagnet - Wednesday, April 17, 2013 - link
SSDs are dramatically more vulnerable to brown outs and power surges than mechanical drives. This SSD's price point made me consider briefly I could forgo hard drives completely but SSDs aren't quite there yet.leexgx - Tuesday, July 1, 2014 - link
interesting (bit of old post to reply to) an SSD dieing to a power surge, i would resolve your issue first