FCAT: The Evolution of Frame Interval Benchmarking, Part 1
by Ryan Smith on March 27, 2013 9:00 AM ESTEnter FCAT
In our comprehensive look at stuttering and FRAPS, we laid out what our ideal method would be for measuring frame intervals. Ideally we would like to be able to tag a frame from the start of the rendering pipeline to the end, comparing frames as they come in and out of the rendering pipeline by time stamping frames and then comparing the intervals in those time stamps to the intervals between the frames at the end of the rendering pipeline when they are displayed. Ideally, these two intervals would match up (or be close enough), with the simulation time between frames coming at an even pace, and the frame interval itself coming at an even pace.
Of course in the real world this isn’t quite impossible, but it’s highly impractical due to the fact that it requires the participation and assistance of the application itself to write the time stamps (by the time draw calls are being made, it’s too late). In lieu of that, simply being able to look at the end of the rendering pipeline would be a major benefit. After all, the end of the rendering pipeline is where frame swaps actually happen, and it is the position in the rendering pipeline that best describes what the user is seeing. If FRAPS isn’t enough because it can only see the start of the rendering pipeline, then the logical next step is to look at the end of the rendering pipeline instead.
This brings us to the subject of today’s article, FCAT, the Frame Capture Analysis Tool.
As we mentioned in our look at stuttering yesterday, as it turns out both NVIDIA and AMD agree with the fundamental problem of trying to judge frame intervals from the start of the rendering pipeline. For the past couple of years NVIDIA has been working on an alternative tool to measure frame latency at the end of the rendering pipeline, and at long last they are releasing this tool to reviewers and the public. This tool is FCAT.
So what is FCAT? FCAT is essentially a collection of tools, but at its most fundamental level FCAT is a simple, yet ingenious method to measure frame latency at the end of the rendering pipeline. Rather than attempting to tap into the video drivers themselves – a process inherently fraught with problems if you’re intending to do it in a vendor-neutral manner that works across all video cards – through FCAT NVIDIA can do true frame analysis, capturing individual frames and looking at them to determine when a buffer swap occurred, and in turn using that to measure the frame interval.
How FCAT Works
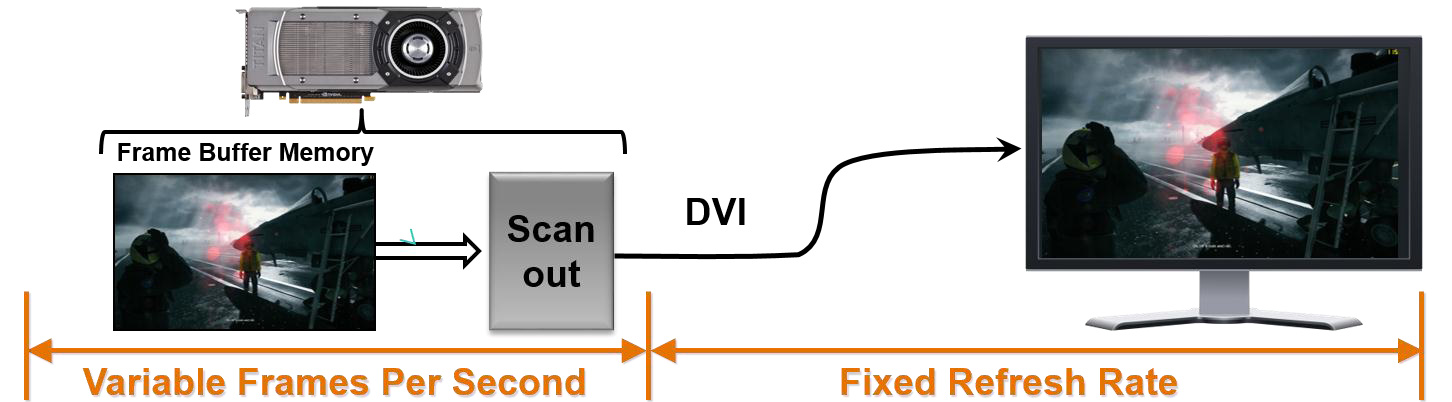
So how does FCAT work? FCAT is essentially a 2 part solution. We’ll dive into greater detail on this in part 2 of our FCAT article, but in summary, due to the inner-workings of video cards, monitors, and PC capture cards, both monitors and PC capture cards work at fixed intervals. Regardless of the frame rate an application is running at, most PC LCD monitors operate at a 60Hz refresh interval. In the case of v-sync this means buffer swaps are synchronized with the refresh interval (which among other things caps the framerate at 60fps), but when v-sync is disabled, buffer swaps can occur in the middle of a refresh. As a result any given refresh interval can be composed of multiple frames. This makes it possible to display well over 60fps on what’s otherwise a 60Hz monitor, with the end result being that multiple frames can be in one refresh interval.
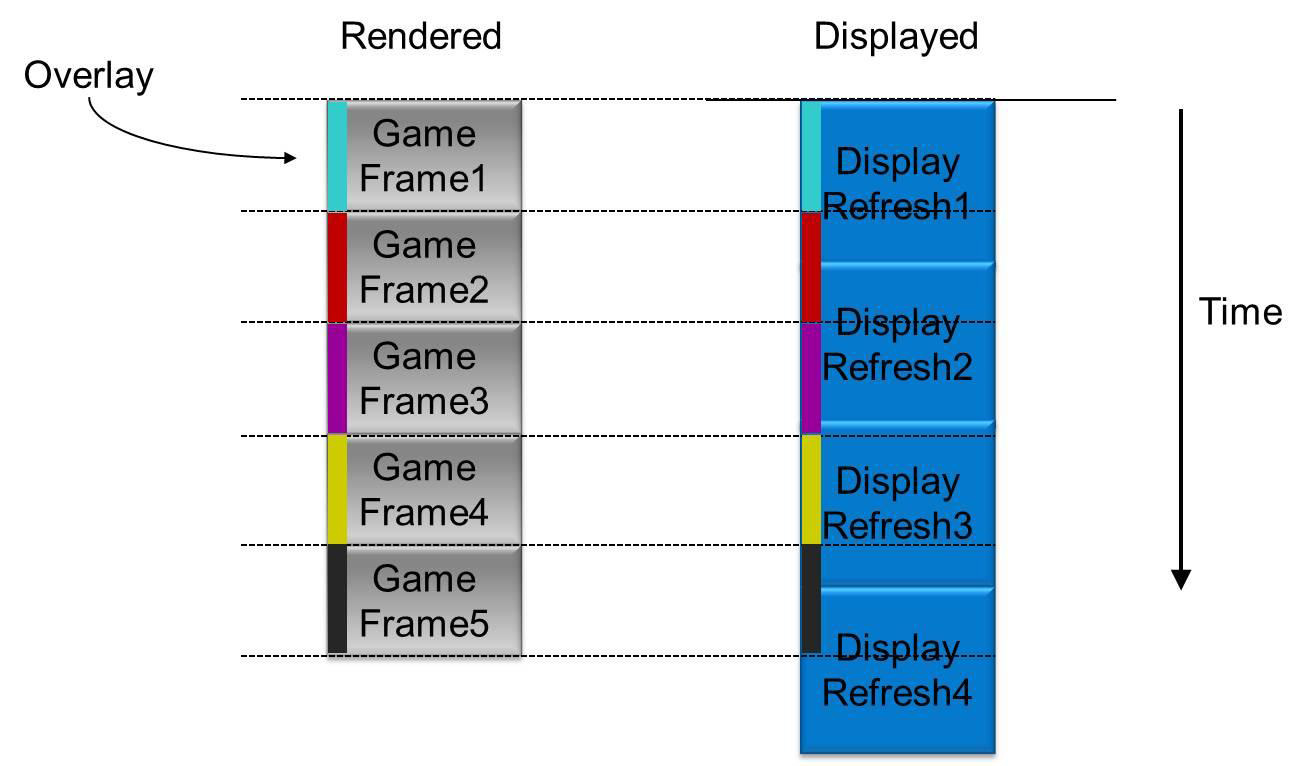
PC capture cards work on the same principle, and just as how a monitor would refresh at 60Hz a PC capture card will capture at 60Hz. The end result being that while a PC capture card can’t see more than 60 whole frames, it can see parts of those frames, and being able to see parts of frames is good enough. In fact it sees the same parts of those frames that a user would see, since the 60Hz refresh rate on a monitor causes the same effect.
Ultimately by capturing frames and analyzing them, it is possible to tell how many frames were delivered in any given refresh interval, and furthermore by counting the time between those partial frames and comparing it to the refresh interval, it is possible to compute just how long the frame interval was and how long any individual frame was visible.
Of course doing this on a raw game feed would be difficult in the best of situations. As a simple thought experiment, consider a game where the player isn’t moving. If nothing changes in the image, how is one to be able to tell if a new frame has been delivered or not?
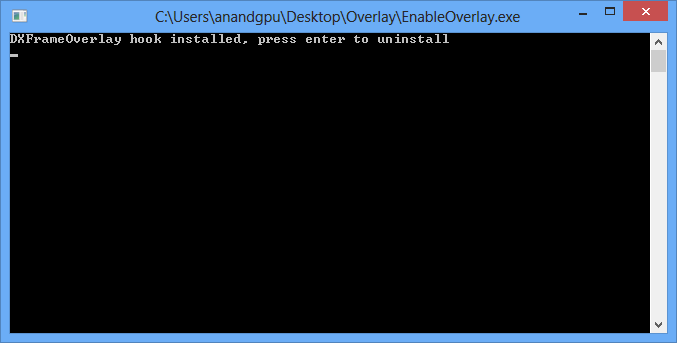
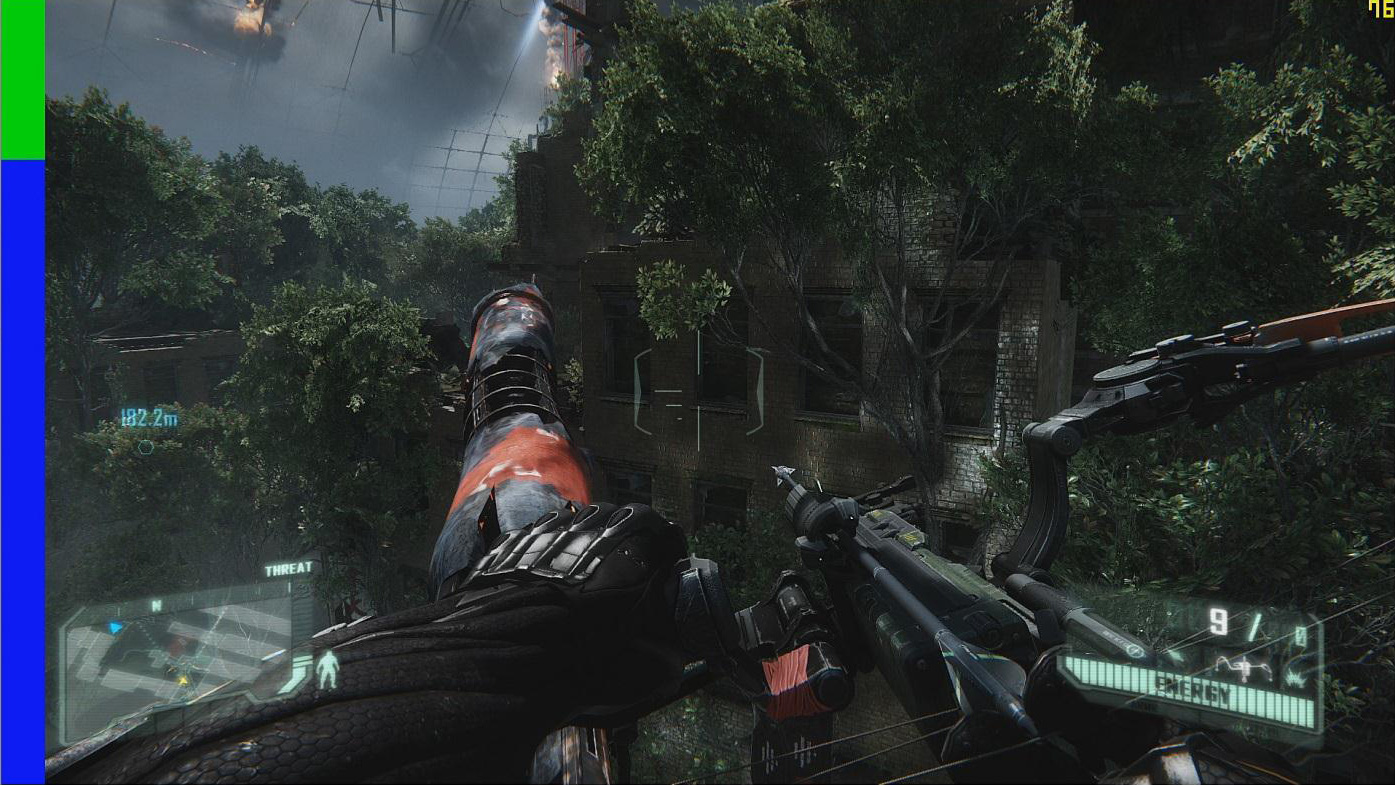
The solution to this is in the first-half of FCAT, the overlay tool. The overlay tool at its most basic level is a utility that color-codes each frame entering the rendering pipeline. By tagging frames with color bars, it is possible to tell apart individual frames by looking at the color bars. Regardless of the action on the screen (or lack thereof), the color bars will change with each successive frame, making each frame clear and obvious.
On a technical level, the FCAT overlay tool ends up working almost identically to video game overlays as we see with FRAPS, MSI Afterburner, and other tools that insert basic overlays into games. In all of these cases, these tools are attaching themselves to the start of the rendering pipeline, intercepting the Present call, adding their own draw commands for their overlay, and then finally passing on the Present call. The end result is that much like how FRAPS is able to quickly and simply monitor framerates and draw overlays, the FCAT overlay tool is able to quickly insert the necessary color bars, and to do so without ever touching the GPU or video drivers.
With the frames suitably tagged, the other half of the FCAT solution comes into play, the extractor tool. By using a PC capture card, the entire run of a benchmark can be captured and recorded to video for analysis. The extractor tool in turn is what’s responsible for looking at the color bars the overlay tool inserts, parsing the data from a video file to find the individual frames and calculate the frame intervals. Though not the easiest thing to code, conceptually this process is easy; the tool is merely loading a frame, analyzing each line of the color bar, finding the points where the color bar changes, and then recording those instances.

This ultimately results in a Tab Seperated Values file that contains a list of frames, when they occurred, the color bar they were attached to, and more. From here it is possible to then further process the data to calculate the frame intervals.
The end result of this process is that through the use of marking frames, capturing the output of a video card, and then analyzing that output, it is possible to objectively and quantitatively measure the output of a video card as an end-user would see it. This process doesn’t answer the subjective questions for us – mainly, how much stutter is enough to be noticed – but it gives us numbers that we can use to determine those answers ourselves.
Finally, for the purposes of this article we’ll be glossing over the analysis portion of FCAT, but we’ll quickly mention it. Along with the overlay and extractor tools, FCAT also includes a tool to analyze the output of the extractor tool, from which it can generate graphs, identify so-called “runt” frames, and more. The analysis tool is not strictly necessary to use FCAT – one can always do their own analysis – but the analysis tool does simplify the use of the suite by quickly and conveniently handling that last step of the process. We’ll get into the analysis tool in much greater detail in part 2 of our article, where we can apply it to our full suite of test results to better understand what it looks for and what it’s representing.


88 Comments
View All Comments
Spoelie - Wednesday, March 27, 2013 - link
On the previous article similar remarks were made: http://www.anandtech.com/comments/6857/amd-stutter...In essence, stuttering in the game simulation is being downplayed maybe a bit too much.
Very intuitively, suppose that in the simulation an object moves from one side of the screen to the other at a constant speed, and suppose there is a stutter in there caused by:
1) the context queue being full
2) the simulation engine being blocked by this fact
(and also assume the simulation timer is written independent of the rendering pipeline of course, otherwise fast/slow rendering would accelerate/decelerate the simulation time).
Then the simulation might simulate like this (samples over time):
[-X-X-X-------X--]
While the graphic subsystem is able to smooth out the stutter via queues, buffers, ... .
[---X---X---X---X]
Frame delivery in that instance might be smooth, however visually the object will not move at a constant speed, moving slower in the beginning and stuttering/jumping or accelerating at a later stage.
... or I misunderstood some of the materials ;)
Spoelie - Wednesday, March 27, 2013 - link
Or said a little differently, the frame intervals actually should match the simulation intervals to not have a disconnect between the simulation and what's being shown on the screen.wavetrex - Wednesday, March 27, 2013 - link
Today's multi-threaded games use a different thread for simulation.The simulation runs at a constant speed, and sets up variables, which the graphic rendering thread pick up when generating frames. It's totally irrelevant if you have 20 frames or 120 or horrible visual stuttering. The simulation itself will be smooth... but the way it's displayed/presented... that's another thing.
xdrol - Wednesday, March 27, 2013 - link
Doesn't matter if the game engine is running on another thread or not, if it expects one frame to be displayed at t+0ms, the next one at t+10ms, third at t+30ms, then an evenly moving object will be at one third it's way on the second compared to the first and third frames.If you even these frames out, and display them at t+0/t+15/t+30, then the object will be seemingly moving twice the speed between the first and second frames compared to between second-third. That is exactly shuttering.
JPForums - Thursday, March 28, 2013 - link
I also agree with you and Spoelie. Simulation step stutter is also an issue that should be covered. It would be really nice to get simulation timestamps directly from the output of the simulator and match them up to their corresponding output frames. However, this would probably require collaboration with game developers that you probably won't get. Until then, using a tool that works at the output of the renderer (like FRAPS) and can associate simulation steps with output frames would be nice.That said, there is really little that AMD or Nvidia can do to fix issues in the application other than trick it into working correctly. These results would be more useful for game developers developing new engines. Also keep in mind, simulation steps are tied loosely (through queues) to GPU's processing capabilities (unless the bottleneck happens to be before the command is dispatched to D3D). Simulation steps should be roughly equal to frame times on average. If the GPU processing were completely consistent, then the latency between the simulation step and output would be fixed and the output would appear smooth. It is variations in frame times that cause variations in simulation steps. On average, the variations of each should be roughly equal. The worse case stutter, which should be something like double the frame time variation (when simulator is compensating it the opposite direction as the frame time variation), is what we need to look out for. That said, variation in frame time is generally smaller than frame time itself. I would suggest that simulation step stuttering is a smaller problem than frame time stuttering and becomes smaller as frame times get shorter. Point of interest, Nvidia's Frame metering may actually increase simulation step stuttering.
xdrol - Wednesday, March 27, 2013 - link
I agree with this. If the frames aren't displayed at the time the game engine is expecting to, then you will have your should-be-moving-smoothly-objects being quirkly-moving-objects redered with a smooth framerate...Sabresiberian - Wednesday, March 27, 2013 - link
I get your concern, but I'm not sure it's valid. The problem here is differences in frame rates, marked jerkiness where the moving images look like they've slowed down or even stopped and then suddenly jump forward. Evening this out by metering the frames ameliorates the issue, but at the cost of overall frame rates.And, really, what's wrong with the technique, unless it were to bring frame rates down to an unacceptable level, and why would you consider it cheating somehow?
JPForums - Thursday, March 28, 2013 - link
IIRC, frame metering occurs right before output and after the feedback loop. It does nothing to smooth out simulation steps. Further, adding random delays completely unknown to the simulator actually makes simulation step stutter worse. However, I believe simulation step stutter will prove to be a smaller problem than frame time stutter (at least until frame times themselves are long enough to be an issue).JPForums - Thursday, March 28, 2013 - link
As far as I can tell it does not reveal instances of frame metering. While I do believe simulation step stutter to be a less significant problem than frame time stuttering, judicious use of frame metering may elevate its position as you are effectively adding random delays to the output that the simulator knows nothing about and therefore cannot compensate. I would encourage the reviewers here not to dismiss FRAPS completely yet. FCAT seems to be the better tool for evaluating the end of the pipeline, but until there is a better tool at the beginning of the pipeline that can see fine grained simulation step times, a coarse tool like FRAPS is still useful for revealing coarse simulation step time inconsistencies.justniz - Thursday, March 28, 2013 - link
...but if they did do frame metering (i.e.delaying faster frames) the overall frame rate would drop, which other benchmarks would pick up easily. I'm sure that ATI and nVidia still care about overall FPS too.