AMD Comments on GPU Stuttering, Offers Driver Roadmap & Perspective on Benchmarking
by Ryan Smith on March 26, 2013 2:28 AM ESTThe Tools of the Trade: FRAPS & GPUView
Now that we have a basic understanding of the rendering pipeline and just what stuttering is, it’s time to talk about the tools that are commonly used to measure these issues. We’ll start with FRAPS, both because FRAPS is well understood by many of our readers and because FRAPS is what brought stuttering to the forefront of review sites in the first place.
AMD, quite bluntly, has a problem with how FRAPS is being used in some cases. To be clear here FRAPS is a wonderful tool, and without it we would be unable to include a number of different games in our hardware reviews. AMD’s problem with FRAPS is not its existence, what it does, or even how it does things. AMD’s problem with FRAPS comes down how it’s interpreted.
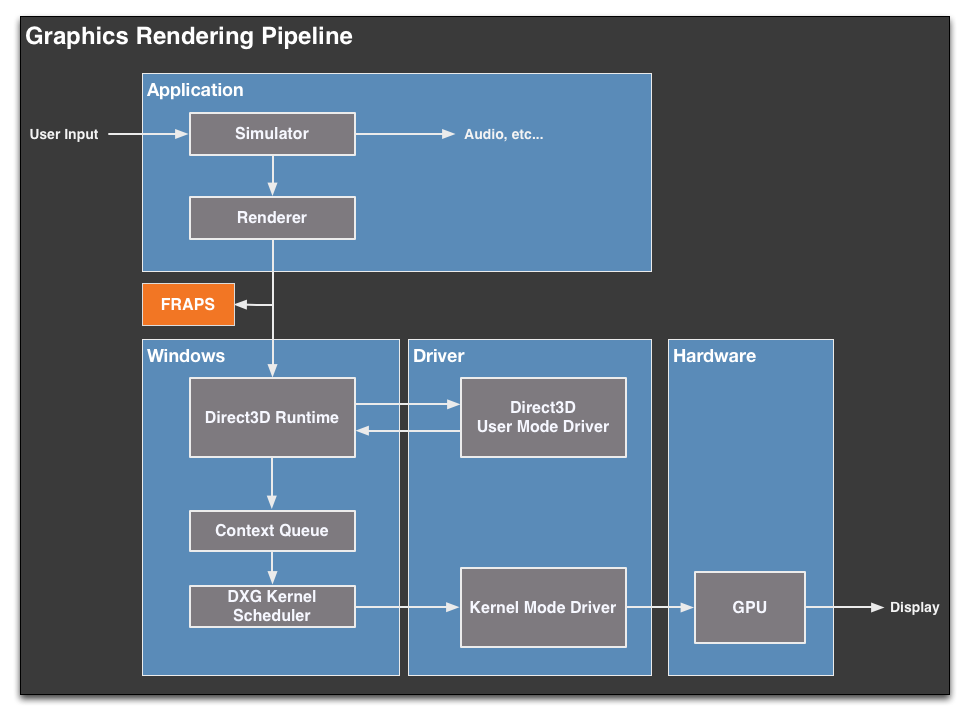
To get to that problem, we’re going to have to take a look at how FRAPS measures framerates. Going back to our diagram of the rendering pipeline, FRAPS hooks into the pipeline very early, at the application stage.
By injecting its DLL into the application, FRAPS then serves to intercept the Direct3D Present call as it’s being made to Direct3D. From here FRAPS can then delay the call for a split second to insert the draw commands to draw its overlay, or FRAPS can simply move on. When it comes to measuring framerates and frametimes what FRAPS is doing is to measure the Present calls. Every time it sees a new present call get pushed out, it counts that as a new frame, does any necessary logging, and then passes that Present call on to Direct3D.
This method is easy to accomplish and works with almost any application, which is what makes FRAPS so versatile. When it comes to measuring the average FPS over a benchmark run for example, FRAPS is great because every Present call it sees will eventually end up triggering a frame to be displayed. The average framerate is merely the number of Present calls FRAPS sees, divided by how long FRAPS was running for.
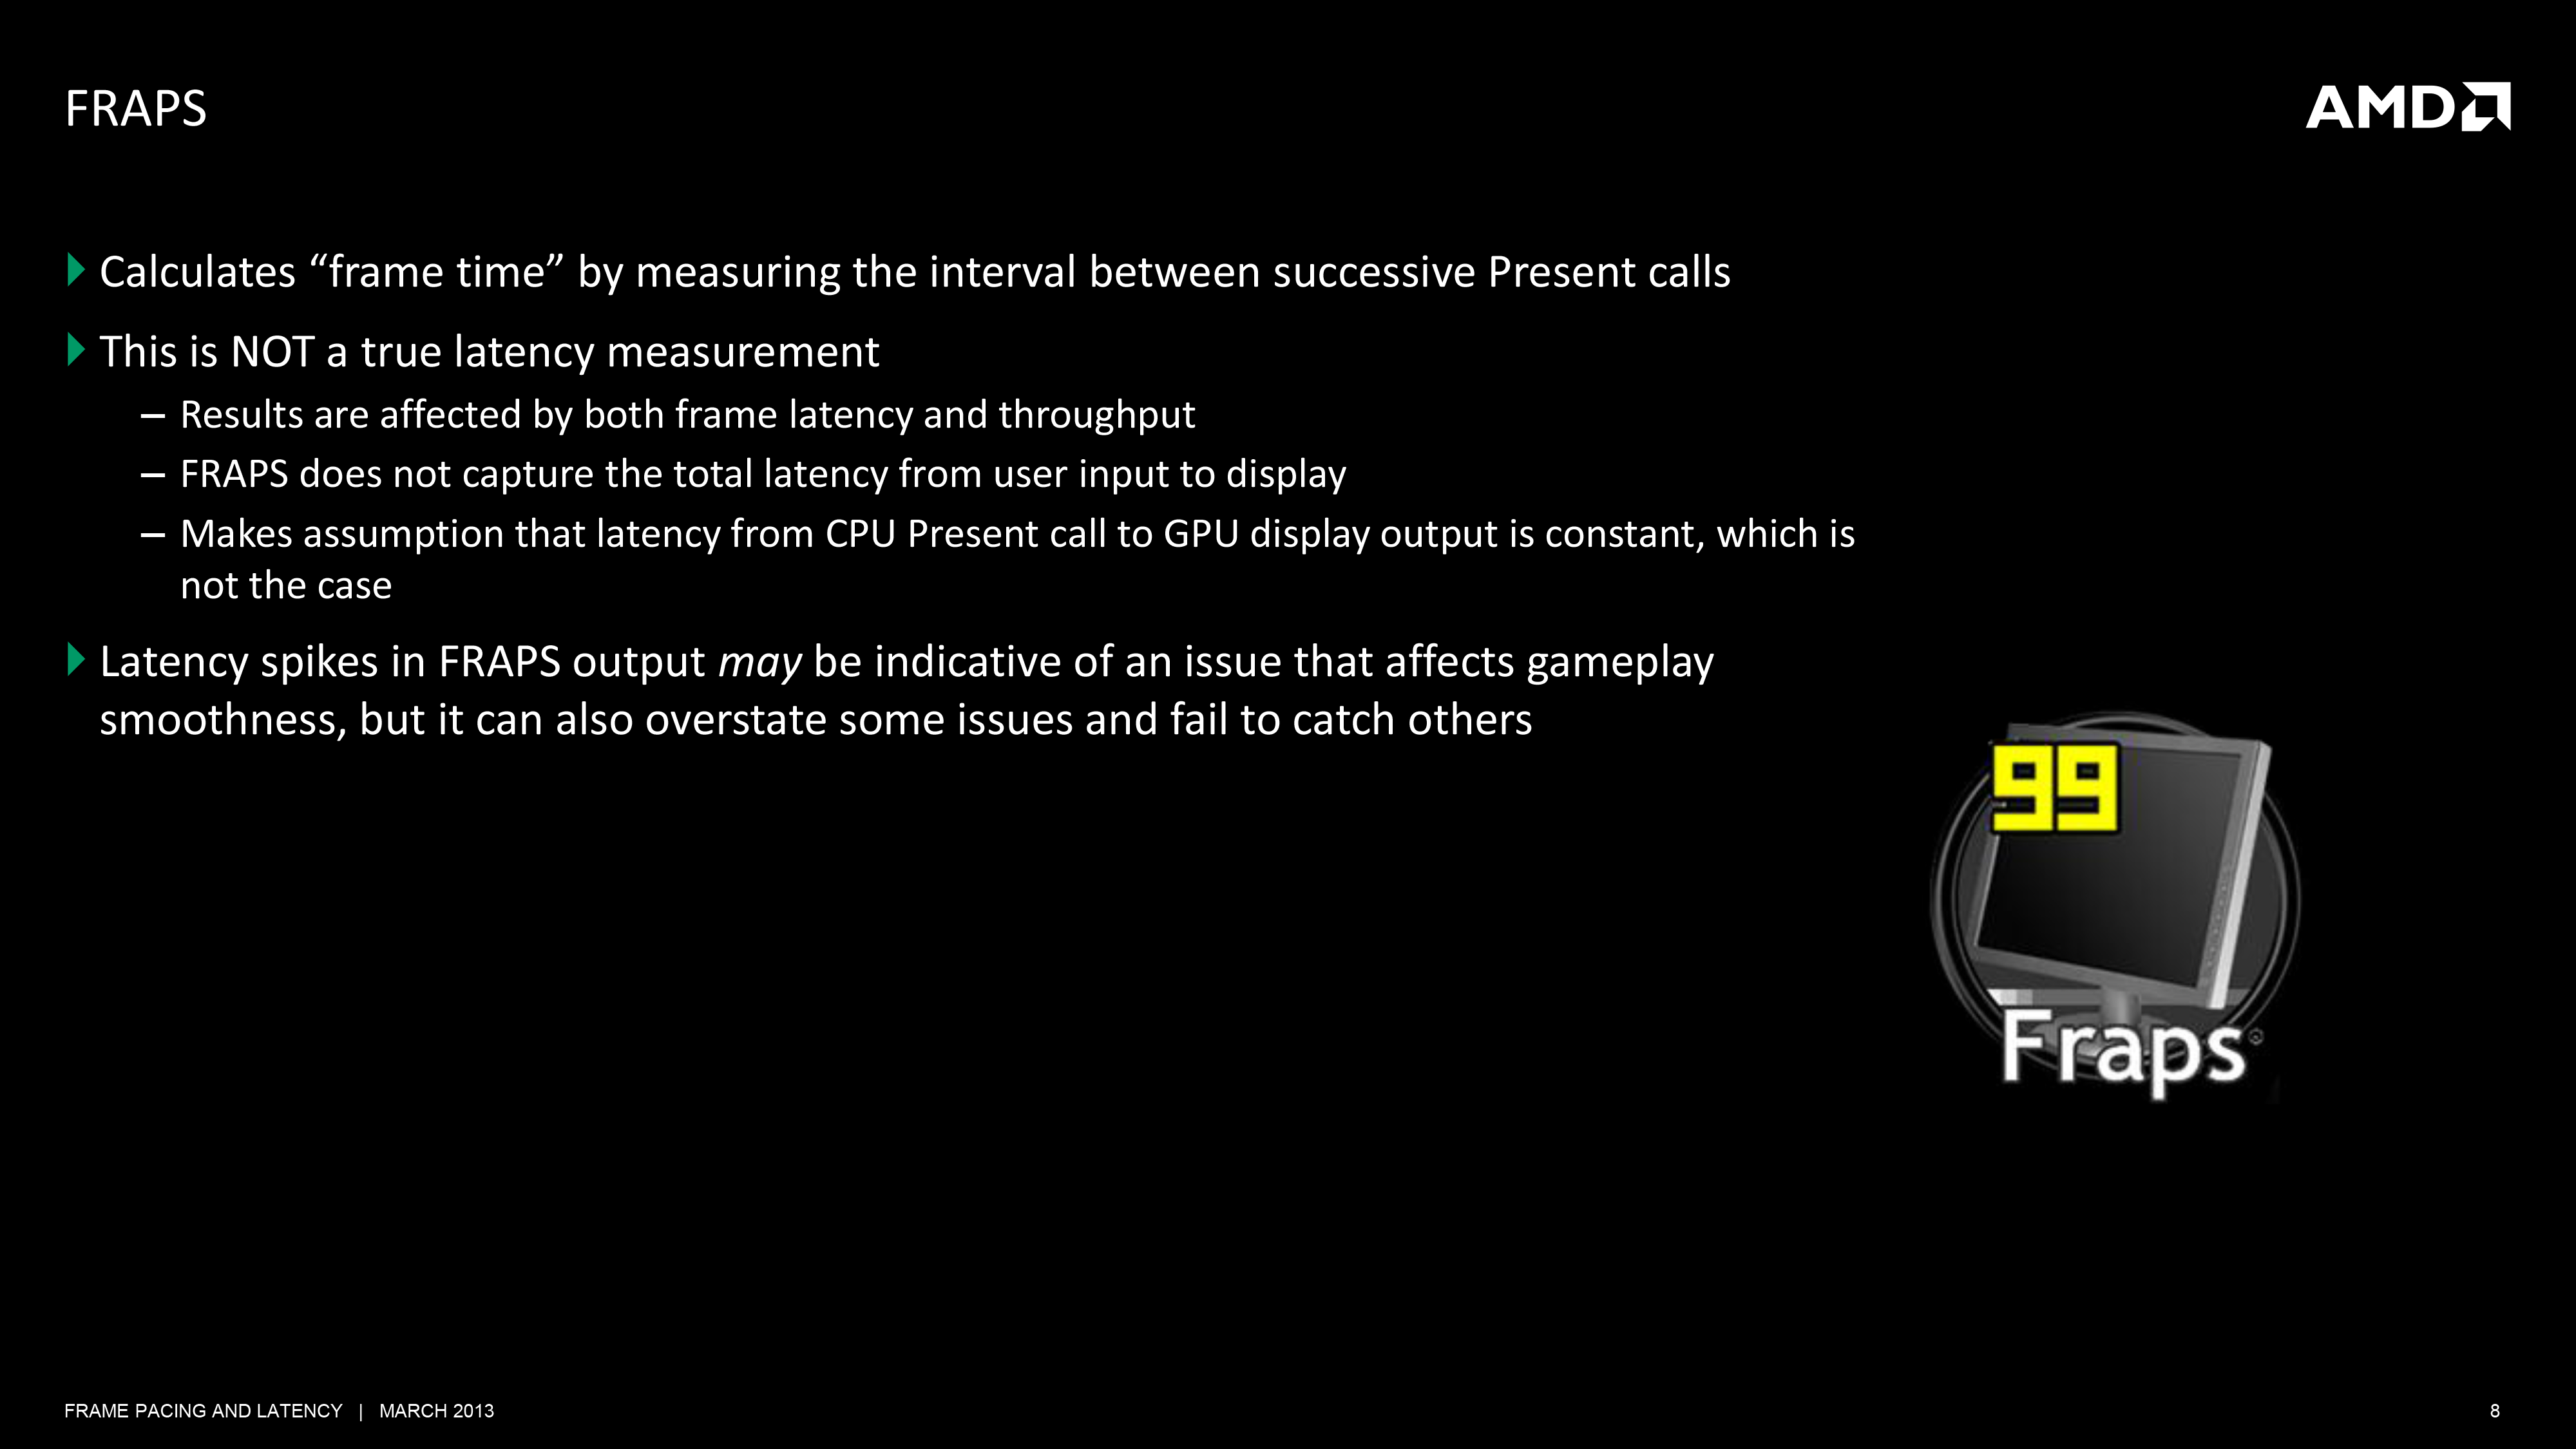
The problem here is not in using FRAPS to measure average framerates over the run of a benchmark, but rather when it comes to using FRAPS to measure individual frames. FRAPS is at the very start of the rendering pipeline; it’s before the GPU, it’s before the drivers, it’s even before Direct3D and the context queue. As such FRAPS can tell you all about what goes into the rendering pipeline, but FRAPS cannot tell you what comes out of the rendering pipeline.
So to use FRAPS in this method as a way of measuring frame intervals is problematic. Considering in particular that the application can only pass off a new frame when the context queue is ready for it, what FRAPS is actually measuring is the very start of the rendering pipeline, which not unlike a true pipe is limited by what comes after it. If the pipeline is backed up for whatever reason (context queue, drivers, etc), then FRAPS is essentially reporting on what the pipeline is doing, and not the frame interval on the final displayed frames. Simply put, FRAPS cannot tell you the frame interval at the end of the pipeline, it can only infer it from what it’s seeing.
AMD’s problem then is twofold. Going back to our definitions of latency versus frame intervals, FRAPS cannot measure “latency”. The context queue in particular will throw off any attempt to measure true frame latency. The amount of time between present calls is not the amount of time it took a frame to move through the pipeline, especially if the next Present call was delayed for any reason.
AMD’s second problem then is that even when FRAPS is being used to measure frame intervals, due to the issues we’ve mentioned earlier it’s simply not an accurate representation of what the user is seeing. Not only can FRAPS sometimes encounter anomalies that don’t translate to the end of the rendering pipeline, but FRAPS is going to see stuttering that the user cannot. It’s this last bit that is of particular concern to AMD. If FRAPS is saying that AMD cards are having more stuttering – even if the user cannot see it – then are AMD cards worse?
To be clear here the goal is to minimize stuttering throughout, and in a bit we’ll see how AMD is doing that and why it was a problem for them in the first place. But AMD is concerned about FRAPS being used in this manner because it can present data that makes stuttering look worse than it is. And in what’s a very human reaction, people pay more attention to bad news than good news; bad data more than good data. Or more simply put, it’s very easy to look at the data FRAPS produces and to see a problem that does not exist. FRAPS doesn’t just lack a good view of the rendering pipeline, but FRAPS data alone doesn’t provide context to decide what data matters and what does not.
Ultimately due to its mechanisms FRAPS is too coarse grained. It doesn’t have a complete picture of the rendering pipeline, and it’s taking readings from the wrong point in the rendering pipeline. In an ideal world we would like to be able to watch a frame in flight from the start to the end; to see what millisecond of a game simulation a frame is from, and to compare that against the frame intervals of successive frames. Baring that we would at least like to see the frame interval at the end of the rendering pipeline where the user is seeing the results, and unfortunately FRAPS can’t do that either.
Adding weight to the whole matter is the fact that FRAPS is one of the few things both AMD and NVIDIA can agree on. In our talks with NVIDIA and in past statements made to the press, NVIDIA dislikes FRAPS being used in this manner for roughly the same reason. The fact that it’s measuring Present calls instead of the time a frame is actually shown to the user impacts them just as well, and muddles the picture when it comes to trying to differentiate themselves from AMD. Again, not to say that NVIDIA thinks FRAPS is a bad tool, but there seems to be a general agreement with AMD’s stance that beyond a certain point it’s the wrong tool for measuring stuttering.
For our part, when we first went into our meeting with AMD we were expecting something a little more standoffish on the matter of FRAPS. Instead what we found was that we were in agreement on the same issues for the same reasons. As you, our readers are quick to point out, we do not currently do frame interval measurements. We do not do that because we do not currently have any meaningful tools to do so beyond FRAPS, for which we have known for years now about how it works and its limitations. There are tools in development that will change this, and this is something we’re hopefully going to be able to talk about soon. But in the meantime what we will tell you is the same thing AMD and NVIDIA will tell you: FRAPS is not the best way to measure frame intervals. There is a better way.
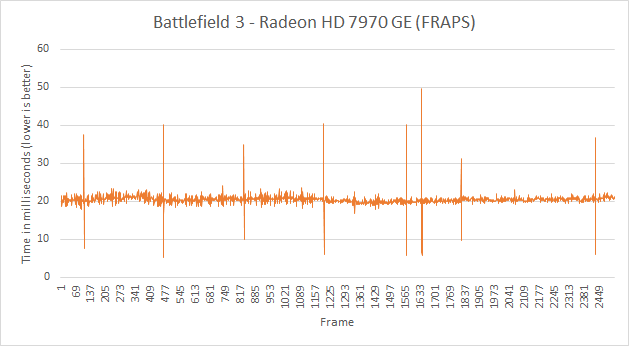
Finally, though we’ve just spent a great deal of time talking about FRAPS’ shortfalls when it comes to measuring frame intervals, we’re not going to dismiss it entirely. FRAPS may be a coarse tool, but even a coarse tool is going to catch big problems. And this is exactly what Scott Wasson and other reviewers have seen. At the very start of this odyssey AMD’s single-GPU frame interval problem was so bad that even FRAPS could see it. FRAPS did in fact “bust” AMD as it were, and for that AMD is even grateful. But as AMD resolves their problems and moves on to finer grained problems, the tools need to become finer grained too. And FRAPS as it currently is cannot make that jump.
GPUView
While we’ve spent most of our discussion on tools discussing FRAPS and why both AMD and NVIDIA find it insufficient, there are other tools out there. AMD and NVIDIA of course have access to far better tools than we do, and people with the knowledge to use them. This includes their internal tools, tools that are part of their respective SDKs, and other 3rd party tools.
AMD’s tool of choice here actually comes from Microsoft, and it’s called GPUView.
GPUView is a GPU performance profiling tool, and it gives very near a top-to-bottom overview of the rendering pipeline. GPUView can see the command buffers, the Present calls, the context queue, the CPU utilization of various threads, the drivers, and more. In fact short of being able to tell us the simulation time, GPUView is the kind of massive data dump a GPU developer, programmer, or even reviewer could ever want.
The only problem with GPUView is that it’s incredibly complex. We’ve tried to use it before and we’re simply overwhelmed with the data it provides. Furthermore it still doesn’t show us when a GPU buffer swap actually takes place and the user sees a new frame, and that remains the basis of any kind of fine-grained look into stuttering. Ultimately GPUView is a tool meant for seasoned professionals and it shows.
So why bring up GPUView at all? First and foremost, it’s one of the same tools AMD is using. Understanding something about the tool they use will bring us closer to understanding how they are (or are not) identifying problems in order to fix them. The second reason is that GPUView can show us in practice what up until now we’ve discussed only in theory: where some of the bottlenecks are in the GPU rendering process that lead to stuttering.

AMD’s presentation to use included two slides on GPUView, which in turn we’re including in this article. The first slide is of Crysis 3, and in it we can see a number of frames in flight. Notably we can also see the periods where there are several idle CPU threads, showing us there is some GPU bottlenecking going on.
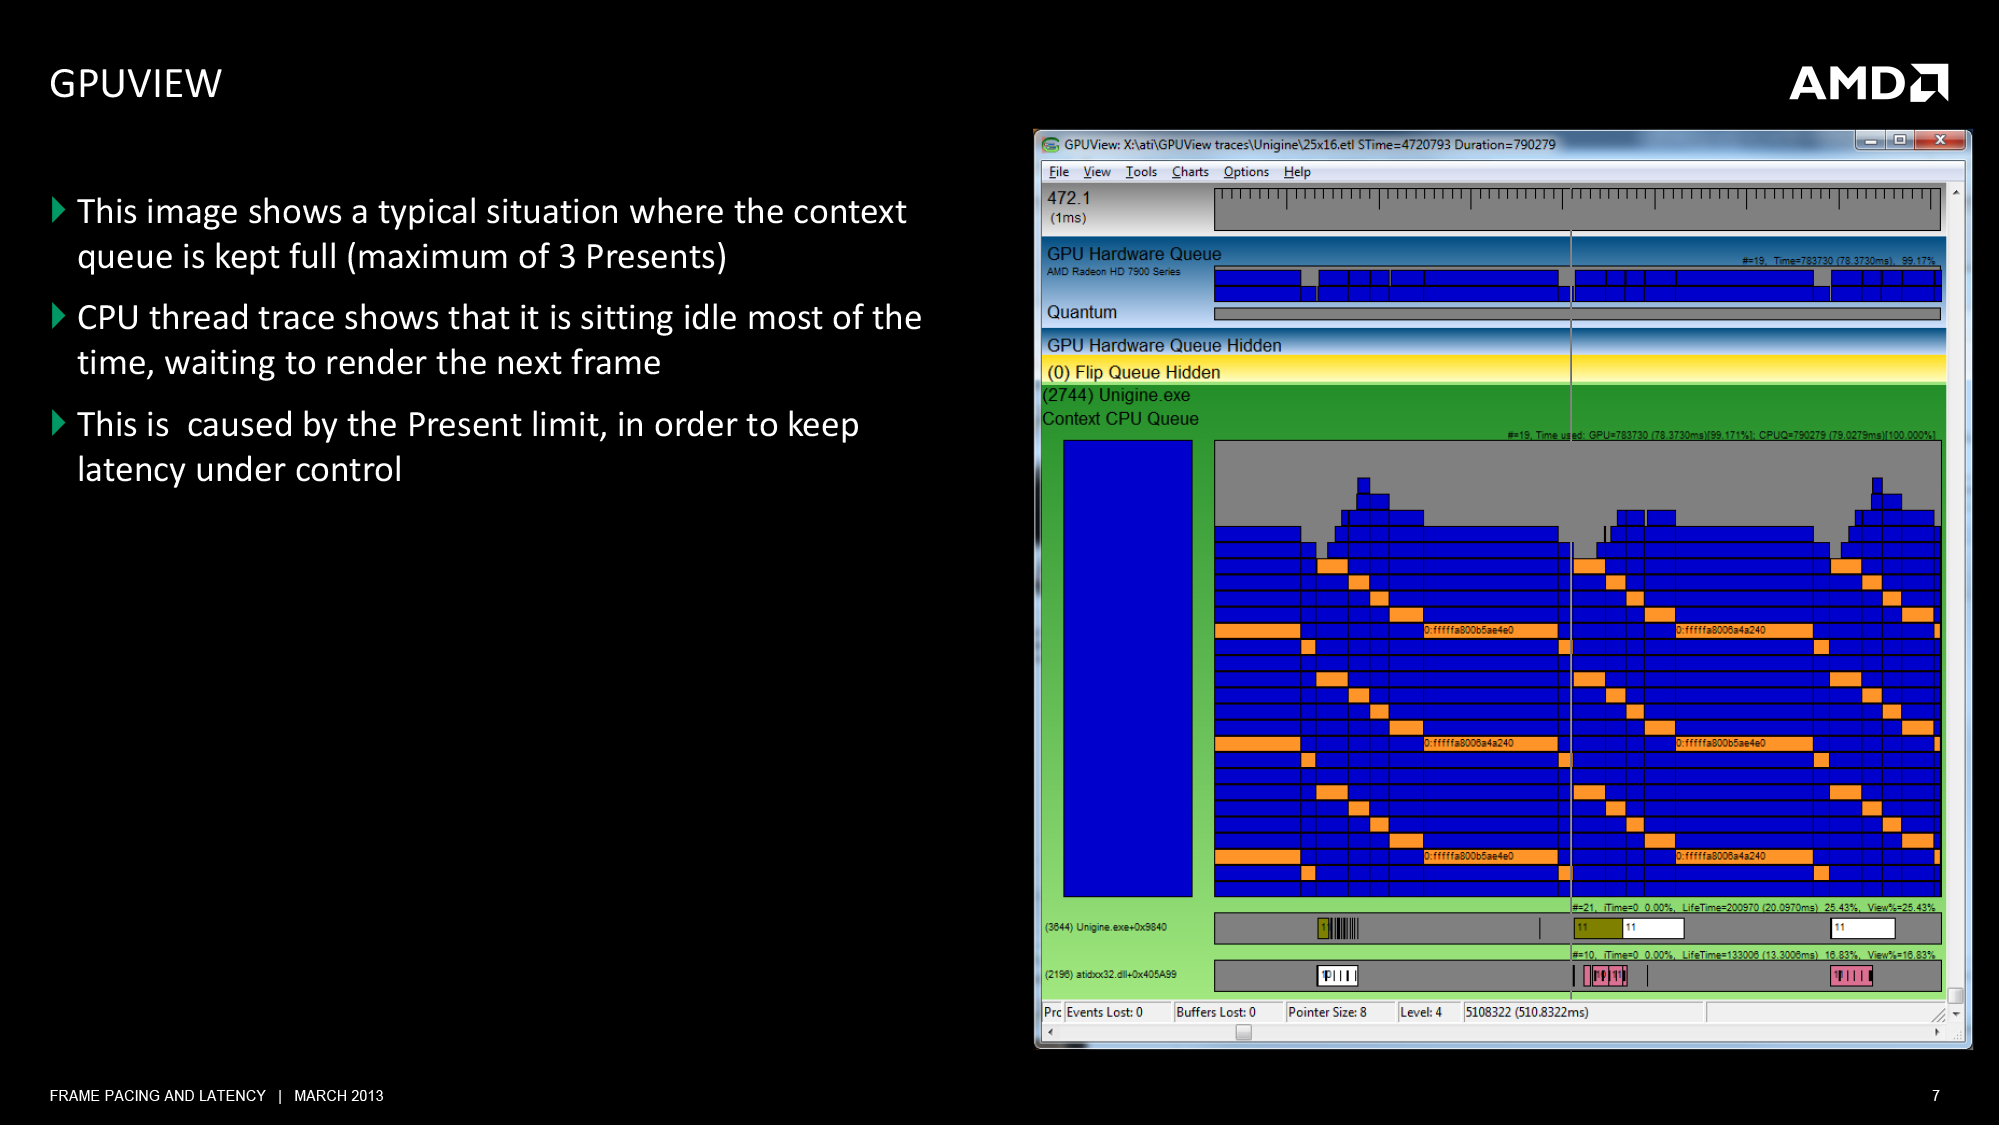
The second slide is of GPUView with Unigine Heaven, presenting us with a textbook situation of where the GPU is the bottleneck, as Heaven is designed from the start to be a GPU benchmark and has limited CPU usage as a result. Of note, we can see the behavior of Heaven as it waits for the context queue to open up to take another frame. Heaven runs with the standard context queue limit of 3, and we can clearly see the 3 Presents, representing the 3 frames in the queue.
Ultimately GPUView is just one of many tools, but it does give us a better idea of what’s occurring in the middle of the rendering pipeline. And in AMD’s case it’s one of the better ways to break down the rendering pipeline and track down the issues that have led to their stuttering problems.


103 Comments
View All Comments
Bilna - Saturday, April 6, 2013 - link
False defintion of Stutter.The main cause of stutter is due to a drop frame (by moving simply the 3d camera face to the polygons, shaders etc...) this can happen on any GPU/CPU, did Nvidia buy you ?
It can happen on video game console too...
Also caused by a non optimized engine that doesn't execute the instructions a render cache to prevent any stutter problem.
I can easily show you that on every GPU/CPU the problem exist but the fact is that problem doesn't come necessarily from the GPU/CPU but more about render path/engine works -> like i said you can prevent this by using a render cache to final render, it's a software problem not a hardware problem...
What about explaining that Nvidia stole works from a certain person ? no you can't talk about that, it would make problem to your website and your Nvidia contract
AvonX - Friday, April 12, 2013 - link
You really are an idiot by supporting and defending a failing company.Dangerous_Dave - Friday, May 10, 2013 - link
I bloody knew it. There were two reasons I moved away from AMD in spite of the on-the-surface better performance per $, and they were 1) Too many of my games wouldn't work properly with some random graphics feature switched on (many hours lost to this) and 2) Nvidia cards just seemed to be more smooth than AMD cards. Vindicated at last! My AMD gaming experience always looked choppy to me even if I was getting 100+fps, whereas Nvidia played more like a console in terms of chocolatey smoothness. Glad I stumped up the extra cash and went Nvidia instead of listening to people talking crap about there being no difference.