3DMark for Windows Launches; We Test It with Various Laptops
by Jarred Walton on February 5, 2013 5:00 AM EST3DMark for Windows Overview
After a two-year hiatus, Futuremark is back with a new version of 3DMark, and in many ways this is their most ambitious version to date. Instead of the usual PC graphics benchmark, with this release, dubbed simply “3DMark” (there’s no year or other designation this time), Futuremark is creating a cross-platform benchmark—Windows, Windows RT, iOS, and Android will all be capable of running the same graphics benchmark, sort of. Today’s release is for Windows only, and this is the most feature-packed of the 3DMark releases with three separate graphics benchmarks.
Ice Storm is a DX9-level graphics benchmark (ed: specifically D3D11 FL 9_1), and this is what we’ll see on Android, iOS, and Windows RT. Cloud Gate is the second benchmark and it uses DX10-level effects and hardware, but it will only run on standard Windows; it’s intended to show the capabilities of Windows notebooks and home PCs. The third benchmark is Fire Strike, and this is the one that will unlock the full potential of DX11-level hardware; it’s intended to showcase the capabilities of modern gaming PCs. Fire Strike also has a separate Extreme setting to tax your system even more.
Each of the three benchmarks, at least on the Windows release, comes with four elements: two graphics tests, a physics test, and a demo mode (not used in the benchmark score) that comes complete with audio and a lengthier “story” to go with the scene. I have fond memories of running various demo scene files way back in the day, and I think the inclusion of A/V sequences for all three scenes is a nice addition. Another change with this release is that all resolutions are unlocked for all platforms; the testing will render internally to the specified resolution and will then scale the output to fit your particular display—no longer will we have to use an external display to test 1080p on a typical laptop, hallelujah! You can even run the Extreme preset for Fire Strike on a 1366x768 budget notebook if you like seeing things render at seconds per frame.
As has been the case with most releases, 3DMark comes in three different versions. The free Basic Edition includes all three tests and simply runs them at the default settings; there’s no option to tweak any of the settings, and the Fire Strike test does not include the Extreme preset. When you run the Basic Edition, your only option is to run all three tests (at least on Windows platforms), and the results are submitted to the online database for management. For $24.99, the Advanced Edition adds the Extreme Fire Strike preset, you can run at custom settings and resolutions, and you can individually benchmark the three tests. There are also options to loop the benchmarks and 3DMark has added a bunch of new graphs; you can also save the results offline for later viewing. Finally, the Professional Edition is intended for business and commercial use and costs $995. Besides all of the features in the Advanced Edition, it adds a command line utility, an image quality tool, private offline results option, and it can export the results to XML.
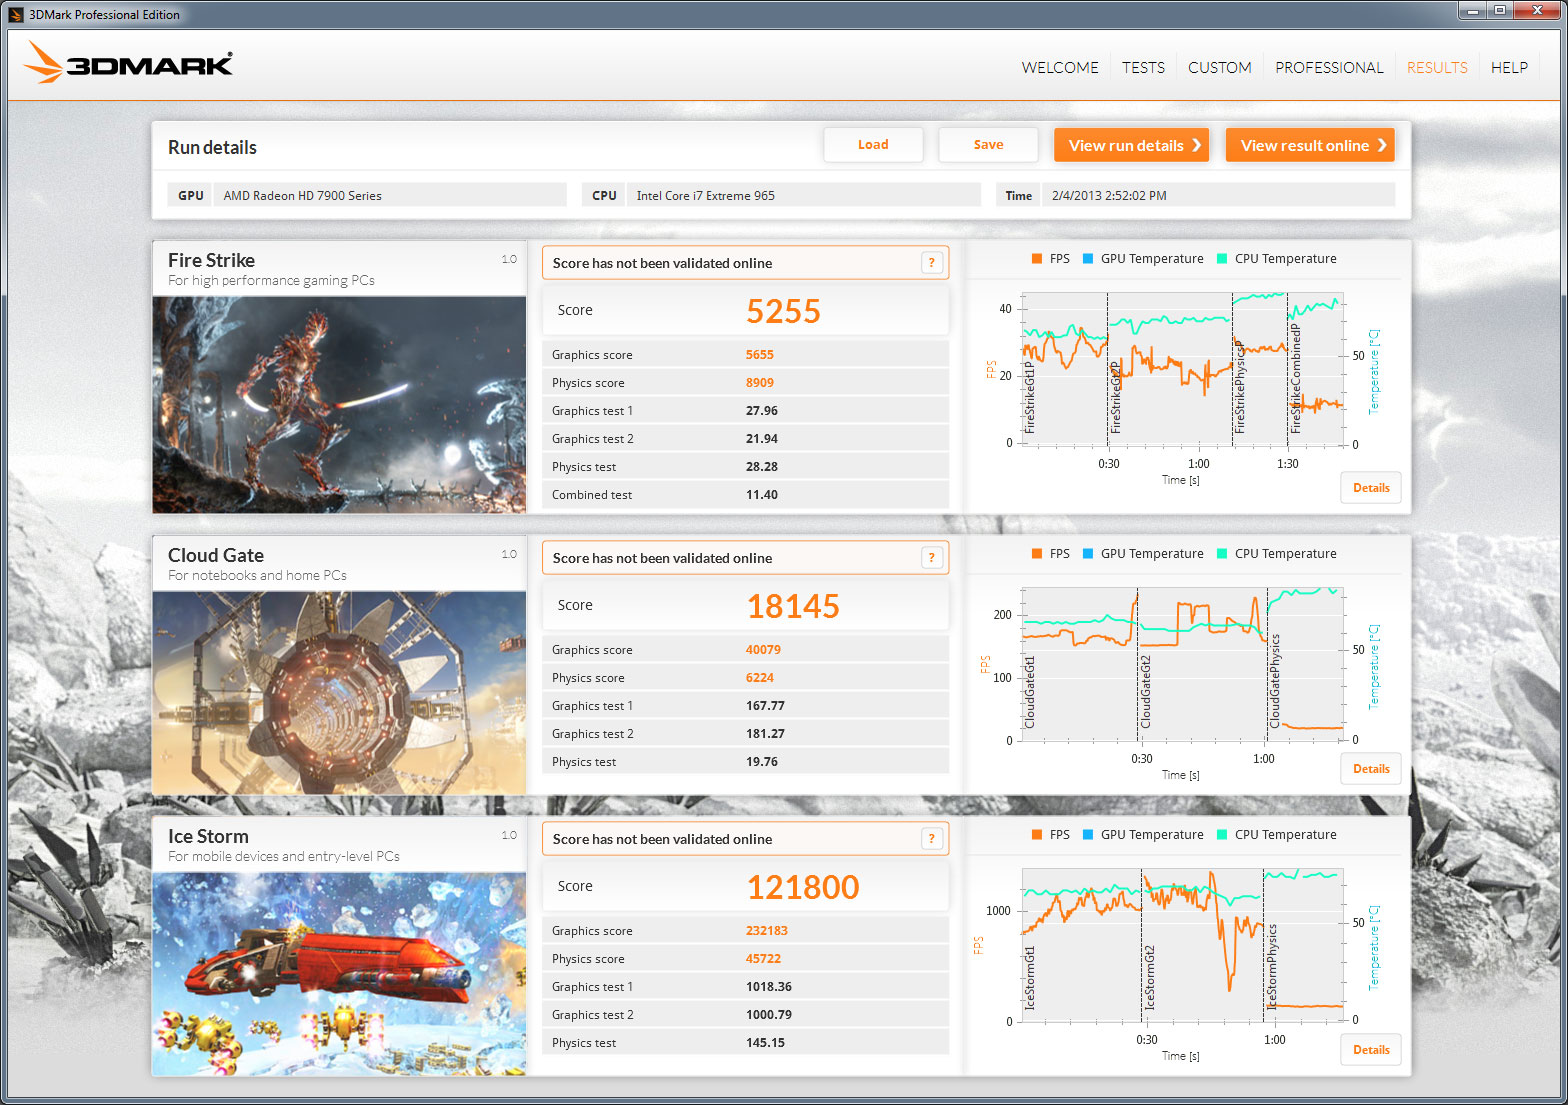
Before we get to some initial results, let’s take a look at one of the cool new features with the latest 3DMark: graphs. Above you can see the post-benchmark results from my personal gaming desktop with a slightly overclocked i7-965X and HD 7950, and along with the usual scores there are graphs for each test showing real-time frame rates and CPU and GPU temperatures. Something I’ve noticed is that the GPU temperatures don’t show up on quite a few of my test systems, and hopefully that will improve with future updates, but this is still a great new inclusion. Each graph also allows you to explore further details:
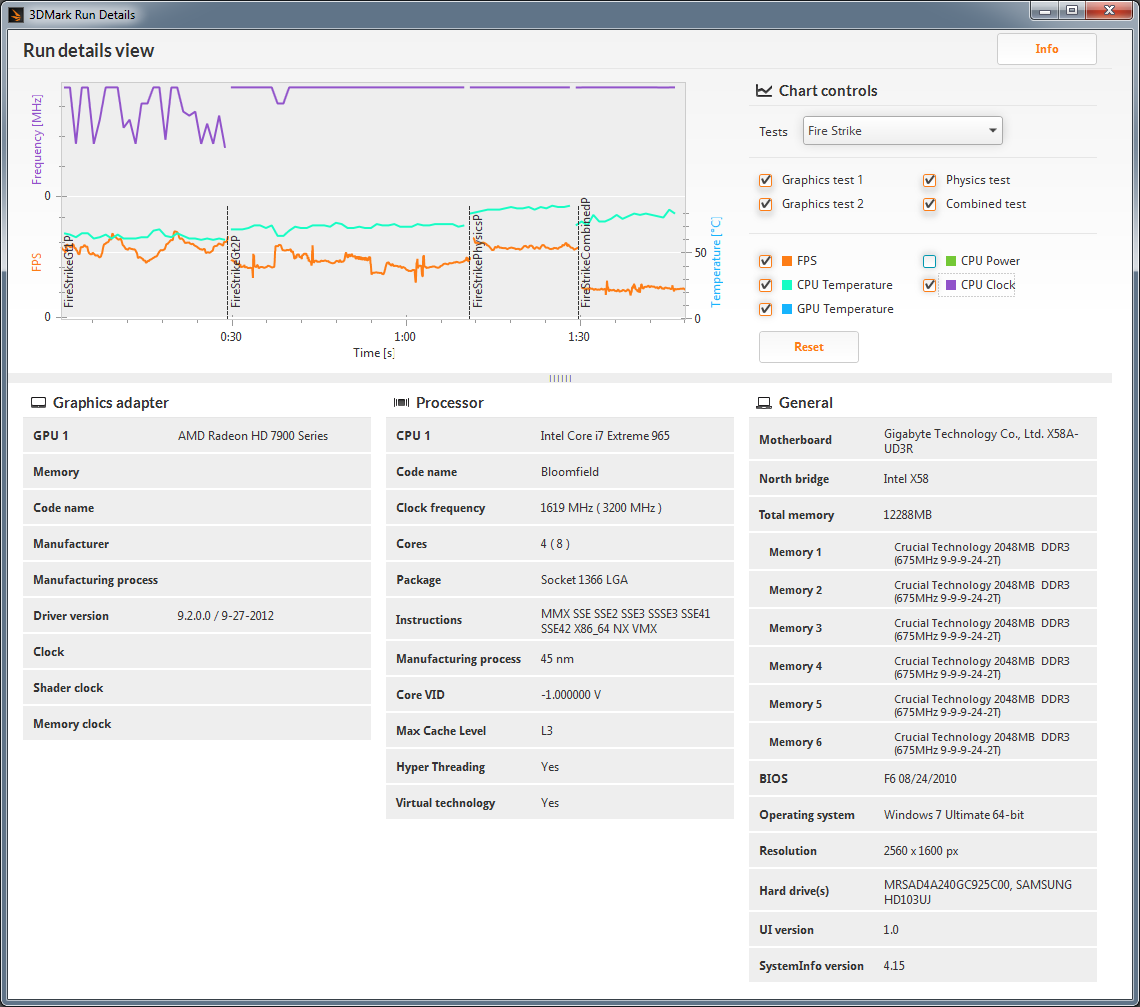
Along with the FPS and temperature graphs, the detailed view also adds the option for CPU clocks and CPU power (though again, power at least isn’t always available depending on the platform, e.g. it’s missing again on my Bloomfield desktop). Something you can’t see with the images is that you can also mouse over and select any of the points on the graphs to get additional details (e.g. frame rate at a specific point), and you can zoom in/out as well. It’s too bad that only paying customers (or press) will be able to get full access to the graphs, but for ORB and overclocking enthusiasts these new features definitely make the $25 cost look more palatable.
Along with the various updates, the UI for 3DMark has change quite a bit as well, presumably to make it more tablet-friendly. I’m not sure how it will work on tablets specifically, but what I can say is that there are certain options that are missing, and the new UI takes some getting used to. For example, even with the Professional Edition, there’s no easy way to run all the benchmarks without the demos. You can run the Ice Storm, Cloud Gate, and Fire Strike benchmarks individually, or you can do a custom run of any of those three, but what I want is an option to run all three tests with custom settings in one batch. This was possible on every previous 3DMark release, so hopefully we get an update to add this functionality (or at least give the Advanced and Professional versions a “run all without demo” on the Welcome screen). Besides that minor complaint, things are pretty much what we’re used to seeing, so let’s do some benchmarking.


69 Comments
View All Comments
mindstorm - Wednesday, February 6, 2013 - link
Result for my Dell M6700 with a FirePro M6000 2GB ram. Test with 13.2 beta 4.http://www.3dmark.com/3dm/63286?
Ice Storm
Overal: 92056
Graphics Score 128702
Physics Score 46107
Cloudgate
Overall: 12160
Graphics Score 15605
Physics Score 6860
Firestrike
Overal: 2241
Graphics Score 2353
Physics Score 9565
Combined Score 896
Better performance on the Ice Storm test then the other notebooks tested. Cloudgate 2nd (of notebooks) and firestrike 3th of notebooks.
All seem to be due to a low graphics score. I suppose this is due to the fact that the M6000 is optimized fore business apps. Although I wonder how much drivers could be of an isue since all the versions I have been trying so far havn't been very stable. 13.1 was a bit more stable then 13.2 overclocking is out of the option with 13.2 beta 4.
Notmyusualid - Wednesday, February 6, 2013 - link
M18x R2.i7 3920XM, 16GB CAS10 RAM.
Left number is your M17x R4's results, middle is the my M18x R2 on ONE 7970M card, right is both 7970Ms in Crossfire (reduced cpu multipliers).:
Ice Storm:
85072 / 146723 / 157182
116561 / 273526 / 343640
43727 / 55947 / 54218
Cloud Gate:
16729 / 18157/ 24279
30624 / 32362 / 65783
6491 / 7159 / 7568
Fire Strike:
4332 / 4467 / 7647
4696 / 4807 / 9542
8910 / 10467 /10449
Also: COMBINED score: 2699
No GPU overclocking.
Operating System is Win 8 (Bloatware) x64, and can't reverse install, and too lazy to restore backup.
Graphics drivers are AMD_Catalyst_13.2_Beta5. (13.1 didn't install at all, 13.2 completed only once). No CAP file for this one yet I don't think.
Crossfire working, but Intel's XTU informs me I was 'throttling', (somewhat) new to me. I game all day on multipliers of 4 cores @ x44, but this benchmark seems to push the system harder.
XTU reports 3% throttling over the benchmark period @ 4cores x44.
I dropped to x44,43,42,41 on beta 5 to allow it to complete the benchmark.
Oddly, Super Pi completes two 32M runs back to back without error on x44,44,44,44. (and it does it a whole 30s slower than on Win 7). Ambient room temp is ~29C. (It's 35C outside).
Hope that is of interest to someone out there.
Spunjji - Thursday, February 7, 2013 - link
Definitely of interest. It's odd how the Graphics scores increase dramatically with Crossfire, as you'd expect, but somehow the Overall scores don't. Seems they've either calibrated the engine or the score generator such that it leans towards overall system performance more than the GPU. Time will tell whether that gives us a reasonable picture of the system's performance, but past experience suggests it won't.Notmyusualid - Friday, February 8, 2013 - link
Yes, good point!The title of the product implies it is for testing 3D performance, yet with significant increases in GPU performance, it is shocking to not see that increase in performance reflected in the overall scores.
I took another look at some other scores online, and it appears to me that the 'Physics Score', is really just a CPU test.
And I thought 3DMark06 was being deprecated for focusing on CPU performance to much (as well as for not being DX11 capable), rather than simply reflecting overall 3D performance, as we'd expect from such a title.
But then, I guess, some games are more CPU-dependent, than others, so maybe it would be a mistake to leave out this sort of test for the average user looking to benchmark his systems' overall gaming performance? I can't say for sure.
Krysto - Saturday, February 9, 2013 - link
I'm really skeptical about 3dmark11 outputting scores that have 1:1 parity between DirectX machines and OpenGL ES 2.0 machines. If it doesn't, then it would be pretty useless for Anandtech's benchmarks, because you're trying to compare GPU's and hardware, not graphics API's.So if say Tegra 3 on Nexus 7 gives a 1000 score, and the Surface RT gives a 1500 score, because the benchmark gives higher score to certain DirectX features, then the benchmark is useless. Because it was supposed to show the GPU's are equal, and it won't.
That's just a speculation for now, but Anand and the guys should really watch out for this.
Krysto - Saturday, February 9, 2013 - link
To be clear, if the drivers are better on one device than the other, then the benchmark SHOULD reflect that, and I'm sure it will. Also it should reflect a higher score if the graphics look better on DirectX machines or anything like that (although that will probably come with a hit in battery life, but that's another issue).What I'm saying is that if everything else is EQUAL , DirectX shouldn't get higher score, just because it's a more complex API than OpenGL ES 2.0. That wouldn't be on its merits.
Also, I'm very disappointing they are making such a big launch out of this, and they aren't even going to support OpenGL ES 3.0 out of the gate, even though it will probably be almost a year even before they release their OpenGL ES 2.0 benchmark, compared to the time when OpenGL ES 3.0 was launched last year.
Clearly they didn't want to prioritize the OpenGL ES part much, even 2.0, let alone 3.0. We might not see 3.0 support until mid 2014 at the earliest from them. Hopefully GLBenchmark 3.0 will come out this year.
shuhan - Wednesday, February 13, 2013 - link
Anyone knows what might be the reason for this:http://www.3dmark.com/3dm/201917
?
Thanks
shuhan - Wednesday, February 13, 2013 - link
Just saw that:"Why is my Ice Storm score so high with my M17x R4 with a 3720QM and 7970M?
http://www.3dmark.com/3dm/18860
129064 overall
244590 graphics
48646 physics"
My result is exactly the same! My rig: Intel Core i5-3570K @4.3, 2x GTX 670
And then my Cloud Gate test scores lower.
failquail - Sunday, February 17, 2013 - link
Certainly seems pretty :)I have CPU and GPU monitoring gadgets running on my second screen, i noticed that whilst the first two tests seemed fairly balanced for CPU/GPU, the third firestrike test maxed out the GPU usage the entire time with the CPU barely hitting 30% usage. A test for the sli/crossfire crowd i think :)
Not sure if it's just a display bug, but it didn't detect my GPU driver at all (ati 6950 modded with 6970 shader count, but GPU/RAM clocks still a little lower than a default 6970) and it detected my fx-8120 CPU (set to 3.4ghz or 4.2ghz turbo) as being 1.4ghz.
Still first go was this:
http://www.3dmark.com/3dm/241866
79420/14031/3423
I need to rerun it though as i had lots of background stuff running and i think i still had AA forced in the GPU driver!