Plextor M5M (256GB) mSATA Review
by Kristian Vättö on April 17, 2013 10:20 AM ESTAnandTech Storage Bench 2011
Two years ago we introduced our AnandTech Storage Bench, a suite of benchmarks that took traces of real OS/application usage and played them back in a repeatable manner. Anand assembled the traces out of frustration with the majority of what we have today in terms of SSD benchmarks.
Although the AnandTech Storage Bench tests did a good job of characterizing SSD performance, they weren't stressful enough. All of the tests performed less than 10GB of reads/writes and typically involved only 4GB of writes specifically. That's not even enough exceed the spare area on most SSDs. Most canned SSD benchmarks don't even come close to writing a single gigabyte of data, but that doesn't mean that simply writing 4GB is acceptable.
Originally we kept the benchmarks short enough that they wouldn't be a burden to run (~30 minutes) but long enough that they were representative of what a power user might do with their system. Later, however, we created what we refer to as the Mother of All SSD Benchmarks (MOASB). Rather than only writing 4GB of data to the drive, this benchmark writes 106.32GB. This represents the load you'd put on a drive after nearly two weeks of constant usage. And it takes a long time to run.
1) The MOASB, officially called AnandTech Storage Bench 2011—Heavy Workload, mainly focuses on the times when your I/O activity is the highest. There is a lot of downloading and application installing that happens during the course of this test. Our thinking was that it's during application installs, file copies, downloading, and multitasking with all of this that you can really notice performance differences between drives.
2) We tried to cover as many bases as possible with the software incorporated into this test. There's a lot of photo editing in Photoshop, HTML editing in Dreamweaver, web browsing, game playing/level loading (Starcraft II and WoW are both a part of the test), as well as general use stuff (application installing, virus scanning). We included a large amount of email downloading, document creation, and editing as well. To top it all off we even use Visual Studio 2008 to build Chromium during the test.
The test has 2,168,893 read operations and 1,783,447 write operations. The IO breakdown is as follows:
| AnandTech Storage Bench 2011—Heavy Workload IO Breakdown | ||||
| IO Size | % of Total | |||
| 4KB | 28% | |||
| 16KB | 10% | |||
| 32KB | 10% | |||
| 64KB | 4% | |||
Only 42% of all operations are sequential; the rest ranges from pseudo to fully random (with most falling in the pseudo-random category). Average queue depth is 4.625 IOs, with 59% of operations taking place in an IO queue of 1.
Many of you have asked for a better way to really characterize performance. Simply looking at IOPS doesn't really say much. As a result we're going to be presenting Storage Bench 2011 data in a slightly different way. We'll have performance represented as Average MB/s, with higher numbers being better. At the same time we'll be reporting how long the SSD was busy while running this test. These disk busy graphs will show you exactly how much time was shaved off by using a faster drive vs. a slower one during the course of this test. Finally, we will also break out performance into reads, writes, and combined. The reason we do this is to help balance out the fact that this test is unusually write intensive, which can often hide the benefits of a drive with good read performance.
There's also a new light workload for 2011. This is a far more reasonable, typical every day use case benchmark. It has lots of web browsing, photo editing (but with a greater focus on photo consumption), video playback, as well as some application installs and gaming. This test isn't nearly as write intensive as the MOASB but it's still multiple times more write intensive than what we were running last year.
We don't believe that these two benchmarks alone are enough to characterize the performance of a drive, but hopefully along with the rest of our tests they will help provide a better idea. The testbed for Storage Bench 2011 has changed as well. We're now using a Sandy Bridge platform with full 6Gbps support for these tests.
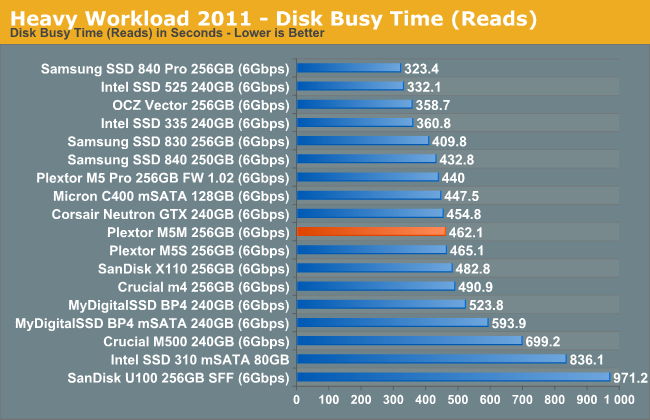
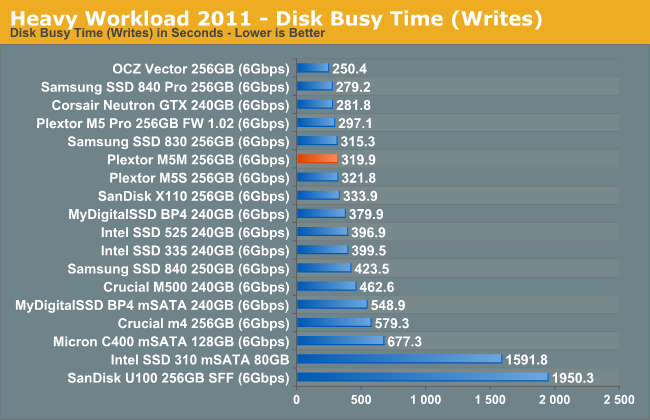
AnandTech Storage Bench 2011—Heavy Workload
We'll start out by looking at average data rate throughout our heavy workload test:
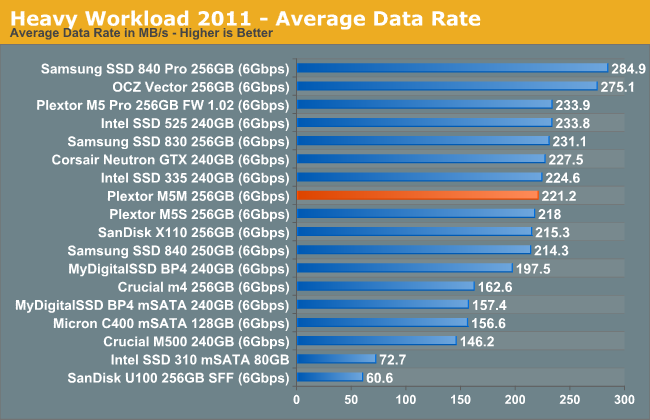
The M5 Pro is able to pull a small lead in our Heavy suite, but the difference is a mere 4%. The difference comes from M5 Pro's higher write speeds, though that was expected since the M5M is limited in terms of NAND bandwidth.
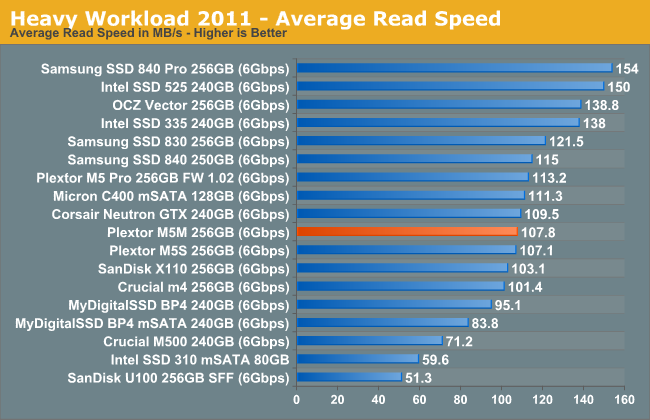
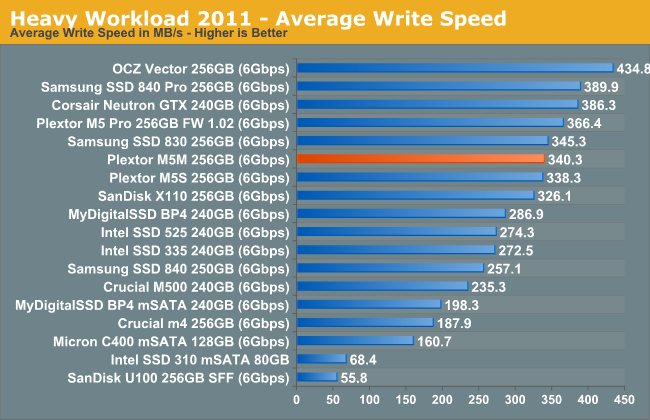
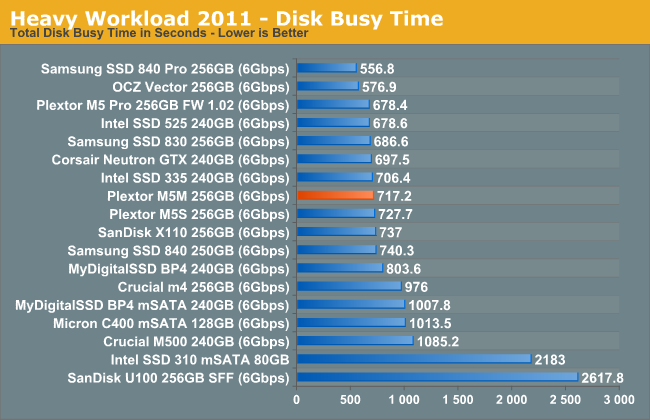
The next three charts just represent the same data, but in a different manner. Instead of looking at average data rate, we're looking at how long the disk was busy for during this entire test. Note that disk busy time excludes any and all idles, this is just how long the SSD was busy doing something:


36 Comments
View All Comments
JPForums - Thursday, April 18, 2013 - link
Sorry, I wasn't trying to bait you. The posts just came off as a little hostile. Probably a result of the my morning meetings.If I'm understanding you correctly, your biggest issue is with the method of consistency. I read in another of your posts that this method is similar to the tests that several large enterprises use. You seem to be familiar with these methods. Is there an alternate (better) method in use that Anandtech could be using? Alternately do you have a superior method in mind that isn't currently in use? I'm guessing (for starters) you'd be happier with a method that measures individual operation latencies (I would too), but I'm unaware any tools that could accomplish this.
JellyRoll - Thursday, April 18, 2013 - link
The consistency testing and all trace based testing used by this site are tested without partitions or filesystems, and no TRIM functionality. This has been disclosed by the staff in the comment sections of previous reviews.If you are testing consumer hardware, the first order of the day is to use methods that accurately reflect real workloads. Removing the must crucial component required for performance consistency (TRIM), then testing 'consistency' anyway, is ridiculous. Would you test a vehicle without fuel?
Kristian Vättö - Thursday, April 18, 2013 - link
TRIM does not affect performance consistency of a continuous write workload. TRIM will only tell the controller which LBAs are no longer in use - the actual LBAs still need to be erased before new data can be written. When you're constantly writing to the drive, it doesn't have time to erase the blocks as fast as new write requests come in, which causes the performance to sink.If you know methods that "accurately reflect real workloads" then please share them. Pointing out flaws is easy but unhelpful unless you can provide a method that's better.
JellyRoll - Thursday, April 18, 2013 - link
Pasted from the Wiki:"The TRIM command is designed to enable the operating system to notify the SSD which pages no longer contain valid data due to erases either by the user or operating system itself. During a delete operation, the OS will both mark the sectors as free for new data and send a TRIM command to the SSD to be marked as no longer valid. After that the SSD knows not to relocate data from the affected LBAs during garbage collection."
During a pure write workload there is no need for the SSD's internal garbage collection functions to read-write-modify in order to write new data. That is the purpose of TRIM. Without TRIM writes require read-write-modify activity, with TRIM they do not. Very easy to see how it boosts performance.
Kristian Vättö - Thursday, April 18, 2013 - link
You still have to erase the blocks, which is the time consuming part. Again, there's no time for normal idle garbage collection to kick in. Yes, the drive will know what LBAs are no longer in use but it still has to erase the blocks containing those LBAs. If you let the drive idle, then it will have time to reorganize the data so that there'll be enough empty blocks to maintain good performance but that is not the case in a continuous write workload.JellyRoll - Thursday, April 18, 2013 - link
It is removing the 'write' from the read-write-modify cycle. Writing a page smaller than the block requires the SSD to relocate the other data in the block first, adding work for the SSD. Remember, they erase at block level. If it isn't aware that the rest of the block is also invalid (the point of TRIM) it must first move the other data.Kristian Vättö - Thursday, April 18, 2013 - link
It's read-modify-write cycle (read the block to cache, modify the data, write the modified data) so the write operation is still there, otherwise the drive wouldn't complete the write request in the first place. You also seem to be assuming that the rest of the pages in the block are invalid, which is unlikely the case unless we're dealing with an empty drive. Hence it's exactly the same cycle with TRIM as you still have to read at least some of the data and then rewrite it. You may have to read/write less data as some of it will be invalid, but remember that garbage collection (with TRIM off) will also mark pages as invalid on its own. That's the reason why performance will stay high even if TRIM is not supported (e.g. OS X), assuming that the garbage collection is effective (there's at least 7% OP so there is always invalid pages).JellyRoll - Thursday, April 18, 2013 - link
I am not assuming the data is still valid, the SSD does. It has to move the data if it considers it valid. TRIM removes the need to move this 'other' data, thus speeding the drive.Kristian Vättö - Monday, April 22, 2013 - link
Here are some tests I did with Plextor M5 Pro XtremeRAW (no partition): https://dl.dropboxusercontent.com/u/128928769/Cons...
NTFS (default cluster size): https://dl.dropboxusercontent.com/u/128928769/Cons...
As you can see, there's no major difference. In fact, there's a bigger slowdown with NTFS versus raw drive.
JPForums - Thursday, April 18, 2013 - link
1) I was not aware that another website created this method of characterizing performance, but I'll give you the benefit of the doubt. Nonetheless, the statement that Anand introduced it to the standard test suite here at Anandtech in the Intel SSD DC S3700 review is a true statement. Given the context of the original statement, this is more likely the intended interpretation. Out of curiosity, which site did create the method?2) I'm not sure whether or not the test measures individual operation latencies or not as IOPS is basically the inverse of an average of the those latencies over time. It is kind of like the difference between FPS and Frame latencies. That said, the representation on the graphs is more the inverse of a one second sliding window average. Saying as much is kind of a mouthful, though. How would you phrase it?