Plextor M5M (256GB) mSATA Review
by Kristian Vättö on April 17, 2013 10:20 AM ESTAnandTech Storage Bench 2011
Two years ago we introduced our AnandTech Storage Bench, a suite of benchmarks that took traces of real OS/application usage and played them back in a repeatable manner. Anand assembled the traces out of frustration with the majority of what we have today in terms of SSD benchmarks.
Although the AnandTech Storage Bench tests did a good job of characterizing SSD performance, they weren't stressful enough. All of the tests performed less than 10GB of reads/writes and typically involved only 4GB of writes specifically. That's not even enough exceed the spare area on most SSDs. Most canned SSD benchmarks don't even come close to writing a single gigabyte of data, but that doesn't mean that simply writing 4GB is acceptable.
Originally we kept the benchmarks short enough that they wouldn't be a burden to run (~30 minutes) but long enough that they were representative of what a power user might do with their system. Later, however, we created what we refer to as the Mother of All SSD Benchmarks (MOASB). Rather than only writing 4GB of data to the drive, this benchmark writes 106.32GB. This represents the load you'd put on a drive after nearly two weeks of constant usage. And it takes a long time to run.
1) The MOASB, officially called AnandTech Storage Bench 2011—Heavy Workload, mainly focuses on the times when your I/O activity is the highest. There is a lot of downloading and application installing that happens during the course of this test. Our thinking was that it's during application installs, file copies, downloading, and multitasking with all of this that you can really notice performance differences between drives.
2) We tried to cover as many bases as possible with the software incorporated into this test. There's a lot of photo editing in Photoshop, HTML editing in Dreamweaver, web browsing, game playing/level loading (Starcraft II and WoW are both a part of the test), as well as general use stuff (application installing, virus scanning). We included a large amount of email downloading, document creation, and editing as well. To top it all off we even use Visual Studio 2008 to build Chromium during the test.
The test has 2,168,893 read operations and 1,783,447 write operations. The IO breakdown is as follows:
| AnandTech Storage Bench 2011—Heavy Workload IO Breakdown | ||||
| IO Size | % of Total | |||
| 4KB | 28% | |||
| 16KB | 10% | |||
| 32KB | 10% | |||
| 64KB | 4% | |||
Only 42% of all operations are sequential; the rest ranges from pseudo to fully random (with most falling in the pseudo-random category). Average queue depth is 4.625 IOs, with 59% of operations taking place in an IO queue of 1.
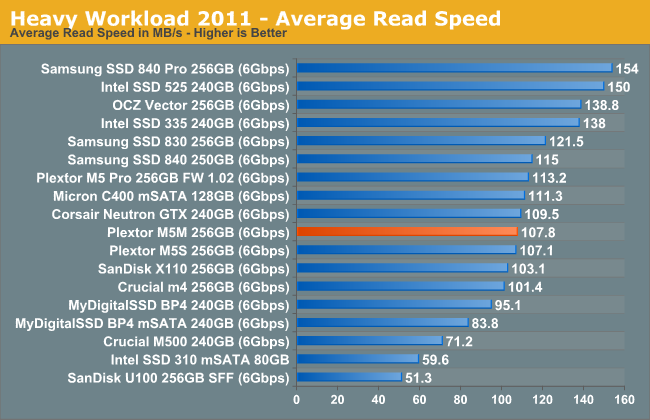
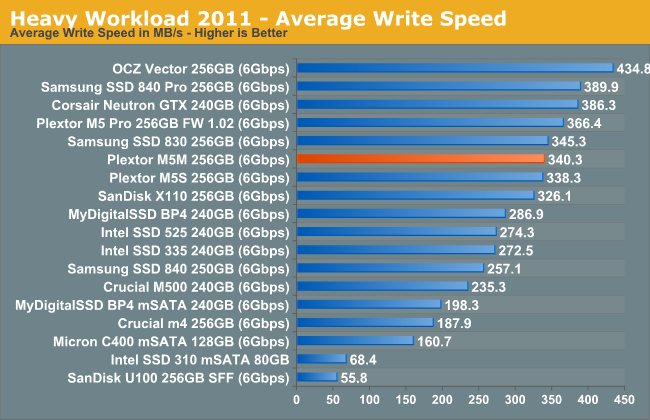
Many of you have asked for a better way to really characterize performance. Simply looking at IOPS doesn't really say much. As a result we're going to be presenting Storage Bench 2011 data in a slightly different way. We'll have performance represented as Average MB/s, with higher numbers being better. At the same time we'll be reporting how long the SSD was busy while running this test. These disk busy graphs will show you exactly how much time was shaved off by using a faster drive vs. a slower one during the course of this test. Finally, we will also break out performance into reads, writes, and combined. The reason we do this is to help balance out the fact that this test is unusually write intensive, which can often hide the benefits of a drive with good read performance.
There's also a new light workload for 2011. This is a far more reasonable, typical every day use case benchmark. It has lots of web browsing, photo editing (but with a greater focus on photo consumption), video playback, as well as some application installs and gaming. This test isn't nearly as write intensive as the MOASB but it's still multiple times more write intensive than what we were running last year.
We don't believe that these two benchmarks alone are enough to characterize the performance of a drive, but hopefully along with the rest of our tests they will help provide a better idea. The testbed for Storage Bench 2011 has changed as well. We're now using a Sandy Bridge platform with full 6Gbps support for these tests.
AnandTech Storage Bench 2011—Heavy Workload
We'll start out by looking at average data rate throughout our heavy workload test:
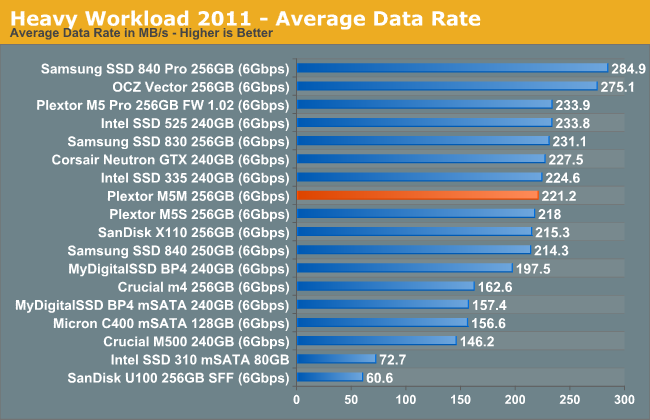
The M5 Pro is able to pull a small lead in our Heavy suite, but the difference is a mere 4%. The difference comes from M5 Pro's higher write speeds, though that was expected since the M5M is limited in terms of NAND bandwidth.
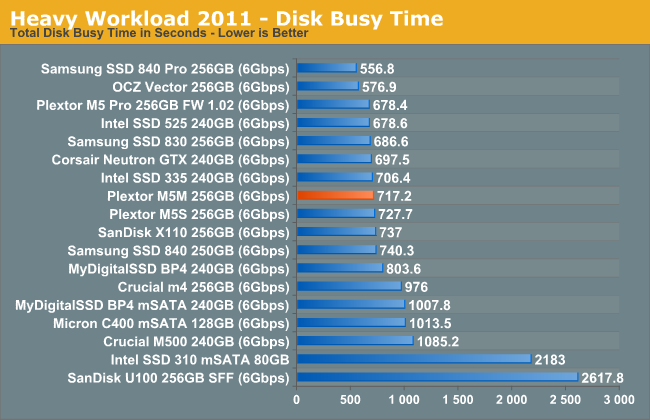
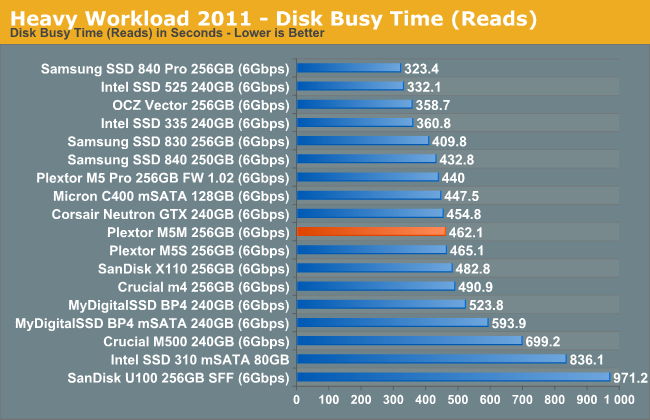
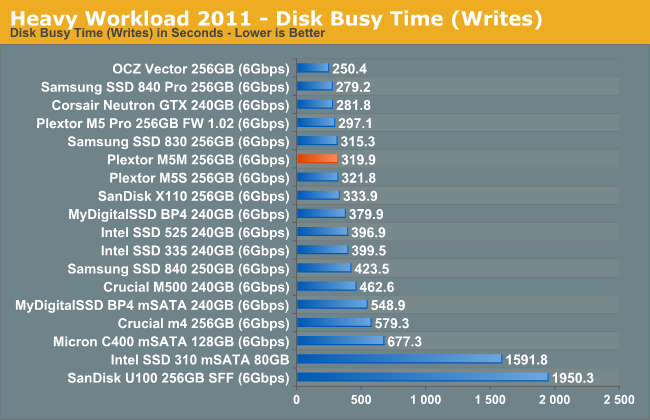
The next three charts just represent the same data, but in a different manner. Instead of looking at average data rate, we're looking at how long the disk was busy for during this entire test. Note that disk busy time excludes any and all idles, this is just how long the SSD was busy doing something:


36 Comments
View All Comments
JellyRoll - Thursday, April 18, 2013 - link
The consistency testing and all trace based testing used by this site are tested without partitions or filesystems, and no TRIM functionality. This has been disclosed by the staff in the comment sections of previous reviews.bobsmith1492 - Wednesday, April 17, 2013 - link
Hi Kristian,Let me know the regulator part number and I can calculate the loss in the regulator. The main difference is if it is a switching or linear part. A linear part will waste 100% * (5-3.3)/5 percent of the power, or 34% neglecting the usually small quiescent current. A switcher will waste less, usually 10-20%.
Kristian Vättö - Wednesday, April 17, 2013 - link
It's Micrel 29150 as far as I know. Here's the datasheet http://www.micrel.com/_PDF/mic29150.pdfAshaw - Wednesday, April 17, 2013 - link
That is a linear part. Current in = current out + the ground pin current. See the graph on page 10. The ground current is about 1/50 the output current in this part. so the input current is a good approximation of the output current.Ashaw - Wednesday, April 17, 2013 - link
So the powers in the graphs above should be approx 0.41W, 2.75W and 2.98 W respectively. (Maybe slightly less in le lower digit if I were to include regulator losses).bobsmith1492 - Wednesday, April 17, 2013 - link
Agreed, the SSD is using approximately 66% of the measured power on the 5V rail.JellyRoll - Wednesday, April 17, 2013 - link
There are two problems with this statement:"In our Intel SSD DC S3700 review Anand introduced a new method of characterizing performance: looking at the latency of individual operations over time."
1. Anand did not introduce this testing, another website did.
2. it isnt looking at individual operations, thousands of operations are happening per second, hence the term 'IOPS' (I/O Per Second)
JellyRoll - Wednesday, April 17, 2013 - link
Actually there is a third problem with the statement, it isnt looking at latency either. It is looking at IOPS, which is much different than latency. There are no latency numbers in this test.JPForums - Thursday, April 18, 2013 - link
There are no latency numbers displayed directly in the results, but latencies are implicit in the IOPS measurement. You may not be getting individual operation latencies, but IOPS is the inverse of average operation latency. So Just divide 1 by the number IOPS and you'll get your average operation latency.In general, I give reviewers the benefit of the doubt and try to put aside small slip ups in nomenclature or semantics as long as it is relatively easy to understand the points they are trying to make. That said, you seem to have it out for Kristian (or perhaps Anandtech as a whole), giving no slack and even reading things into statements that I'm not sure are there. I have no vested interest in Anandtech beyond the interest of reading good reviews, but I have to ask, did Kristian kick your dog or something? I'm honestly interested if you have a legitimate grievance.
JellyRoll - Thursday, April 18, 2013 - link
Pointing out numerous problems with methodology is simply that, in particular the consistency tests are wildly misleading for a number of reasons, the least of which is an unreal workload. I will not resort to replying to thinly veiled flamebait attempts.