ASUS PB278Q Review: An IPS Competitor Emerges
by Chris Heinonen on November 19, 2012 11:00 PM ESTASUS PB278Q Color Quality
The PB278Q ships with an sRGB preset in the display, but unlike the ProArt line this doesn’t come with a guarantee of a DeltaE < 5 for color quality. Since the ProArt DeltaE didn’t meet that standard in my testing (and I don’t have enough details to know what color points they are even testing to get that number), this was a fine change by me. Compared to all the other preset modes, sRGB was by far the most accurate, so I used it for our uncalibrated, 200 nits profile testing.
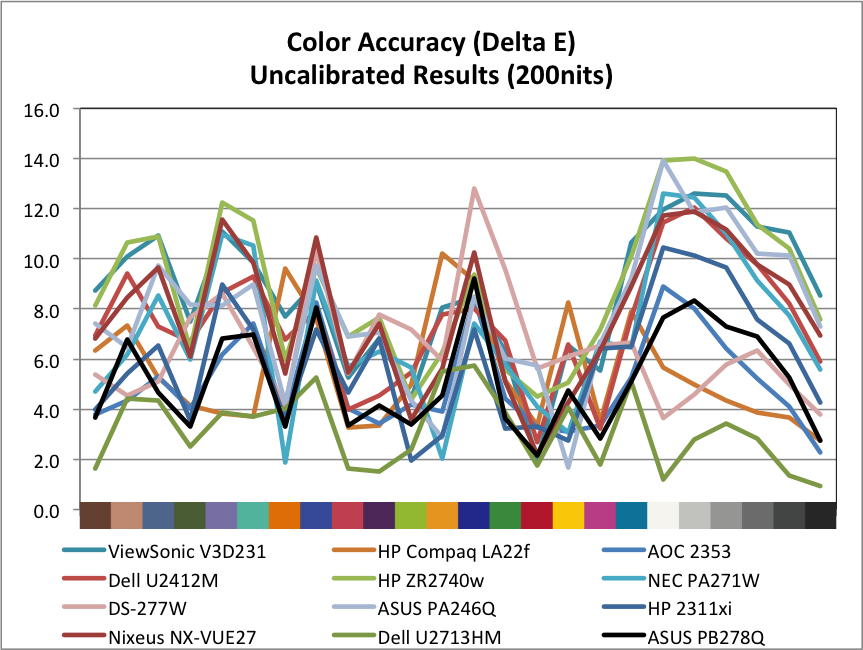
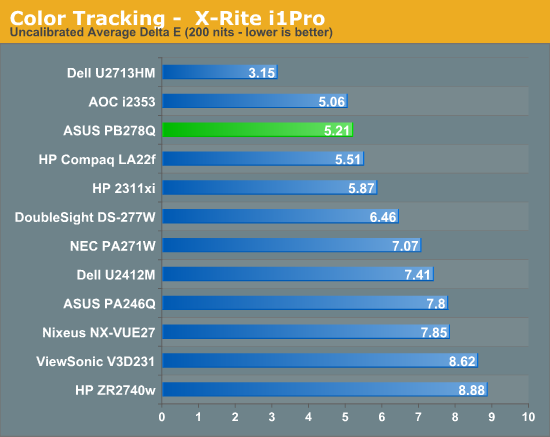
Our average uncalibrated dE is 5.21, which is actually very good for a 27” display right out of the box. You will notice that some 27” displays that were tested prior to my taking over display testing, like the Dell U2711, are not here in the graphs. This is intentional as those were tested with a different combination of hardware that can produce results that look better than they actually are. All of the displays in this chart now are measured using an i1Pro for every measurement except for black level, which an i1DisplayPro is used because of its more accurate low light readings.
Moving past that, the sRGB mode isn’t incredibly accurate in comparison to the recently reviewed Dell U2713HM display, but it is better than every other 27” display I have put onto the bench.
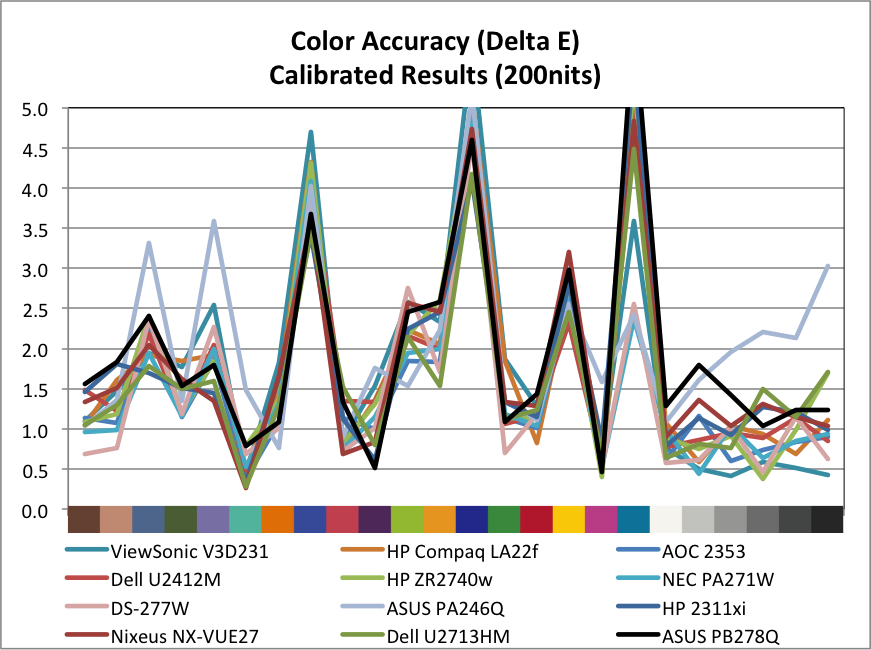
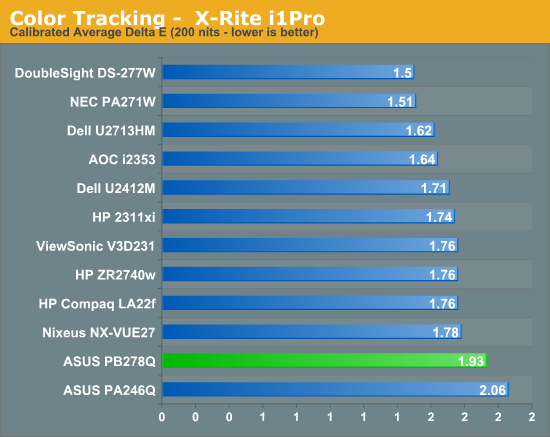
After calibration the PB278Q improved but not as much as some of the other displays have. What is really throwing this off is one shade of blue that has a dE over 6, which pulls that average up. Looking at the median error we still see a worse result than the other 27” displays out there and a grayscale that has a higher dE across the board than the other displays. This is getting picky, since all of these dE values mean that you probably won’t see any difference between the displays, even side by side, but it still doesn’t perform quite as well after calibration.
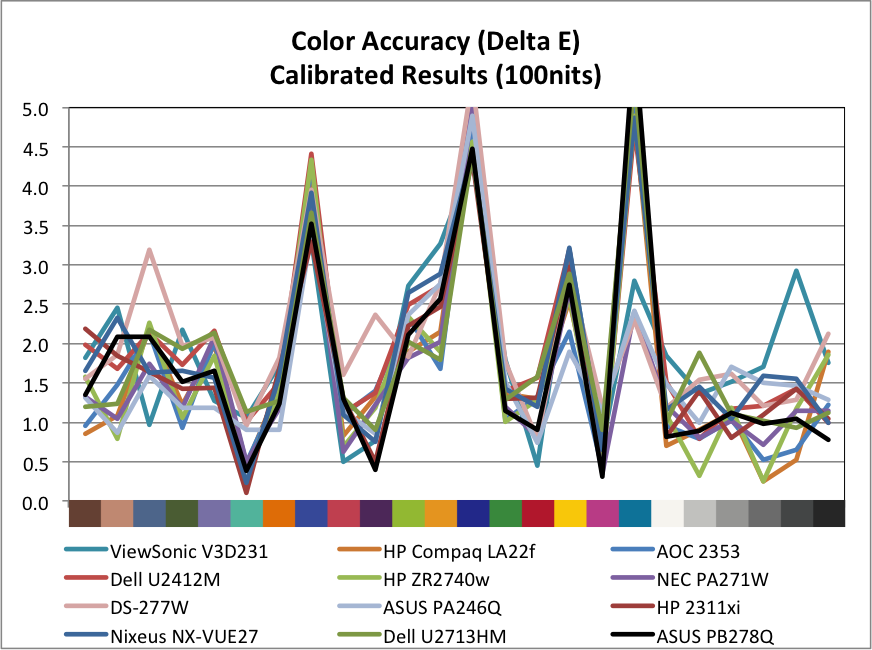
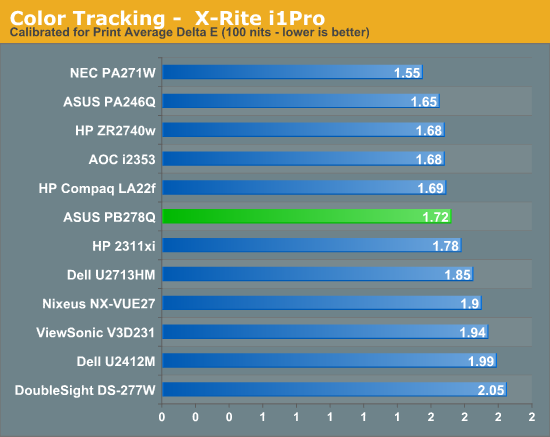
With the brightness range of the PB278Q it was easy to get the ASUS down to 100 nits for our print calibration testing without having to manipulate the LUT to do so. Here we see a bit of an improvement over the 200 nits numbers, and we manage to do better than the other 27” displays we have tested. The NEC is still the leader for low light image quality, but the ASUS is right behind it and would do a good job for those that need to do print work at lower light levels.
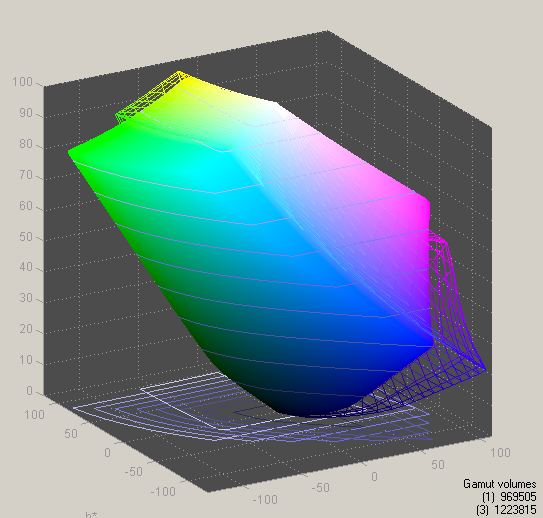
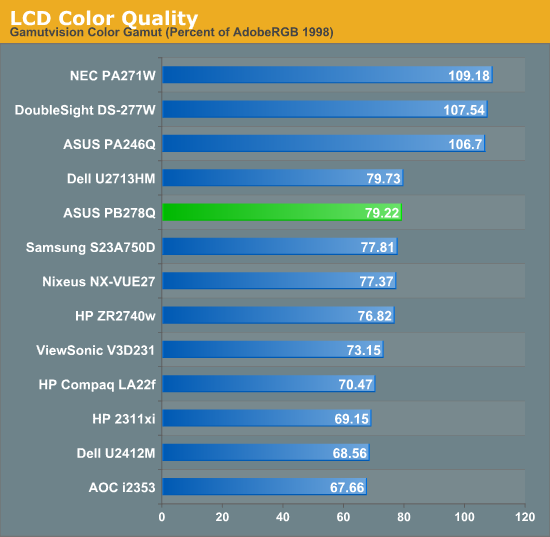
The color gamut on the PB278Q is going to be limited to sRGB due to the use of an LED backlighting system that uses while LEDs, and we see it has 79% of the AdobeRGB gamut available. There's nothing at all surprising or different about this; it's exactly what we expected to see.
Overall the PB278Q does a pretty good job on the color quality testing. The default sRGB mode is better than most and will be good enough for those that want to have more accurate colors but aren’t willing to pay a premium for the hardware to do a full calibration. The 200 nits calibrated numbers are a little worse than I had hoped, but they are so close to others you likely won’t be able to tell at all, and the 100 nits numbers are very good.


55 Comments
View All Comments
cheinonen - Tuesday, November 20, 2012 - link
I don't have the 21:9 Dell, but I have the LG EA93 being written up now.jjj - Tuesday, November 20, 2012 - link
That's great,looking forward to the review.I guess it's the same penel,Dell might use it better but the LG could be cheaper.bcseime - Tuesday, November 20, 2012 - link
The values for U2412M in the processing lag comparison graph does not match the value in the total response time graph.Avalon - Tuesday, November 20, 2012 - link
Ahh, I see you beat me to it.JarredWalton - Tuesday, November 20, 2012 - link
Had the same name twice; fixed now with the slower U2713HM correctly labeled. Thanks!dishayu - Tuesday, November 20, 2012 - link
You should probably try an include a couple of 120Hz LCDs like the Benq XL2410T, atleast in the input lag charts. I'd like to see how far behind IPS panels are, and of course, how close to CRT can a 120Hz LCD get.h107474 - Tuesday, November 20, 2012 - link
Actually they should use the Hazro HZ27WC for input lag comparison of 27" displays. It is also based on the LG panel but it's the ultra cut down cheap version with no scalars, only DVI input and no OSD at all! This means ultra low lag and is why I bought it. Check out the TFT Central review and input lag measurements below:http://www.tftcentral.co.uk/reviews/content/hazro_...
HisDivineOrder - Tuesday, November 20, 2012 - link
I agree. Input lag is quite commonly a problem with monitors with built-in scalers. But then, that was true years ago, too. Not sure why it's still surprising reviewers today...The shocker is they haven't figured out a way to fix or improve this problem.
cheinonen - Tuesday, November 20, 2012 - link
The question was really if using the 1:1 mode with non-native content instead of Full mode, so there was no scaling, would get around the lag hit of the scaler, but it does not do that. I'd like it if monitor vendors could make a lower lag mode, as some TV makers do with their game console modes, but I haven't seen one that has that effect yet.120 Hz LCDs are on the list to do soon and get some better numbers on them.
Olaf van der Spek - Wednesday, November 21, 2012 - link
1:1 requires more buffering than normal scalingBut nobody has been able to explain yet why normal scaling takes so much time.