The Intel SSD DC S3700 (200GB) Review
by Anand Lal Shimpi on November 9, 2012 8:01 AM EST- Posted in
- Cloud Computing
- Storage
- IT Computing
- SSDs
- Intel
Consistent Performance: A Reality?
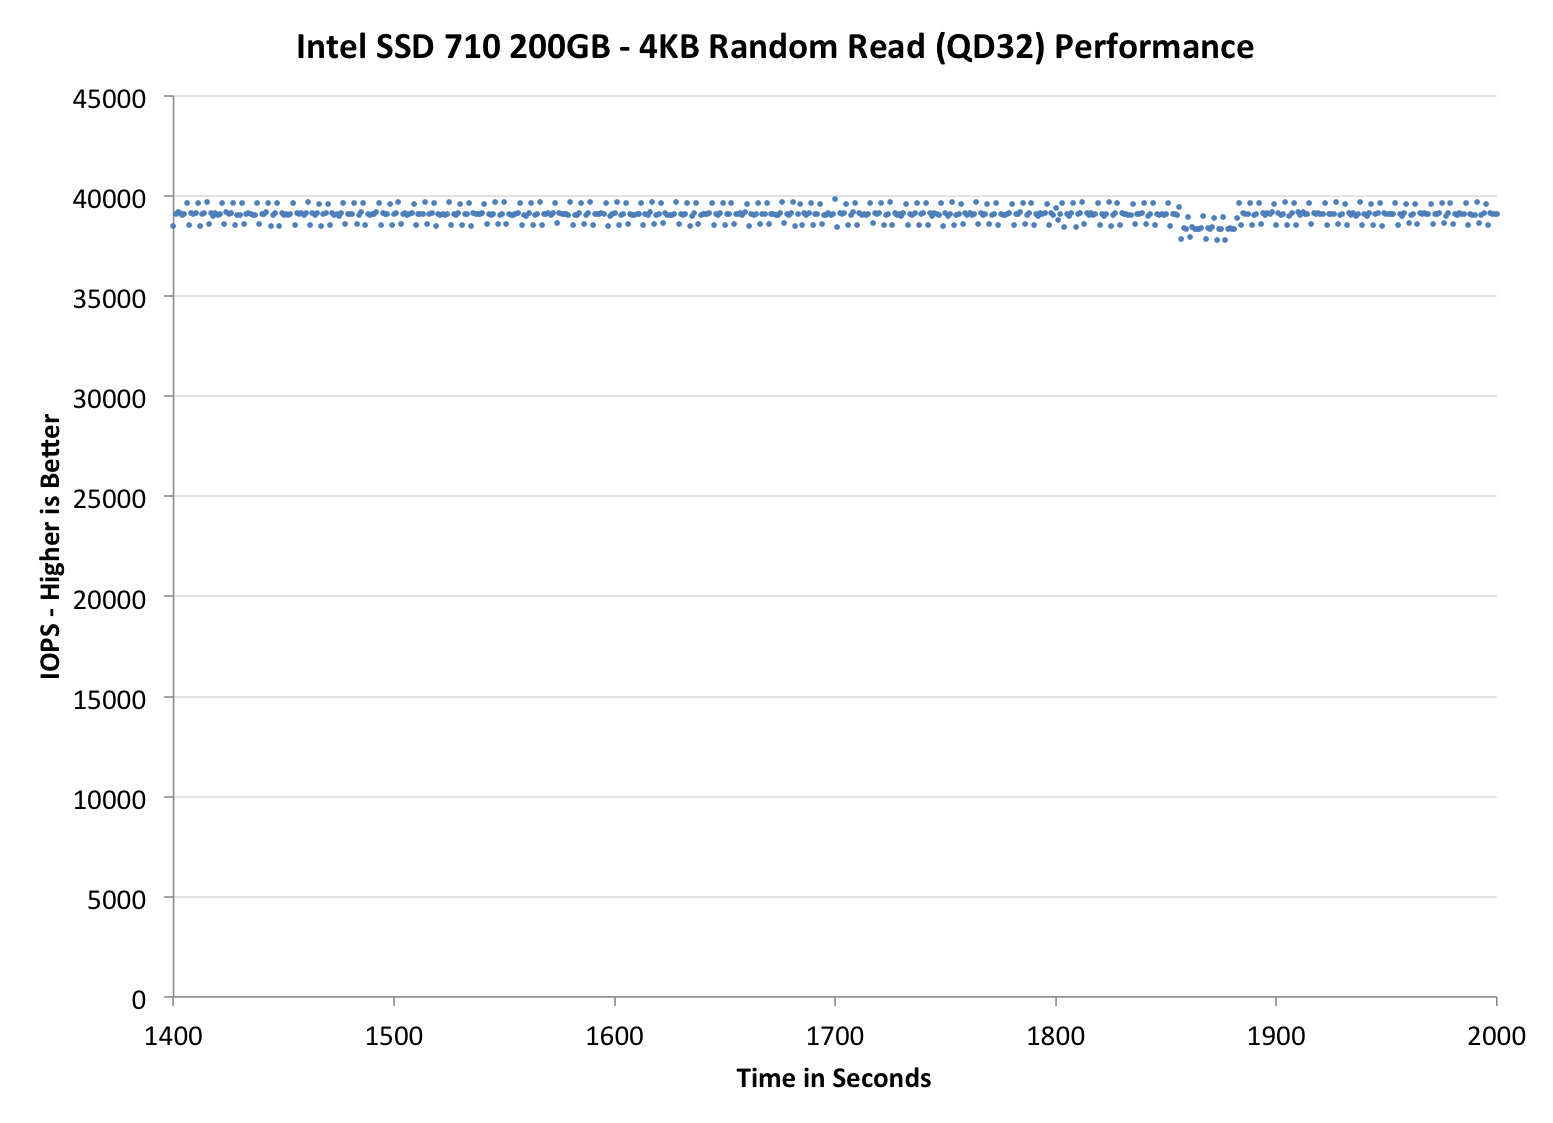
IO latency isn't an issue for most operations. Reads are almost guaranteed to complete relatively consistently so long as you have a decent controller. Similarly, sequential writes are very predictable and tend to be the easiest case to optimize for. You will see differences between drives when looking at read and sequential write latency, but the differences honestly won't be that dramatic. The chart below shows just how consistently random read performance is over time on Intel's SSD 710:
It's the highly random write workloads that really trip up most controllers. You have to properly map random LBAs to physical NAND locations and regularly defragment the NAND to ensure that performance always remains high. All of this happens in real time and while insane amounts of data (and fragments) are flying at the drive. The drive has to balance present needs of high performance with future needs of not leaving the NAND in a fragmented state as well as keeping wear even across all NAND die. It requires a fast controller, a good underlying firmware architecture, and experience.
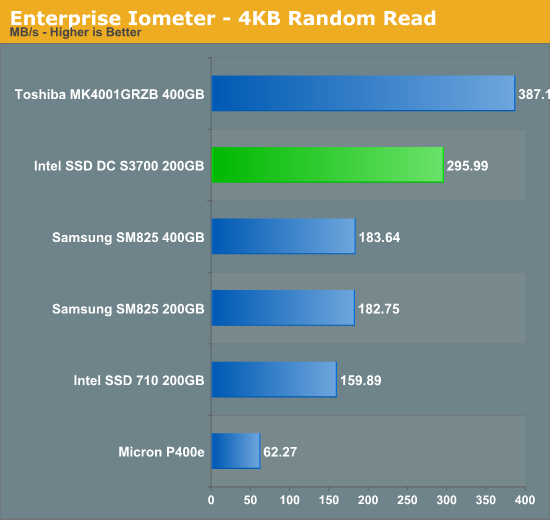
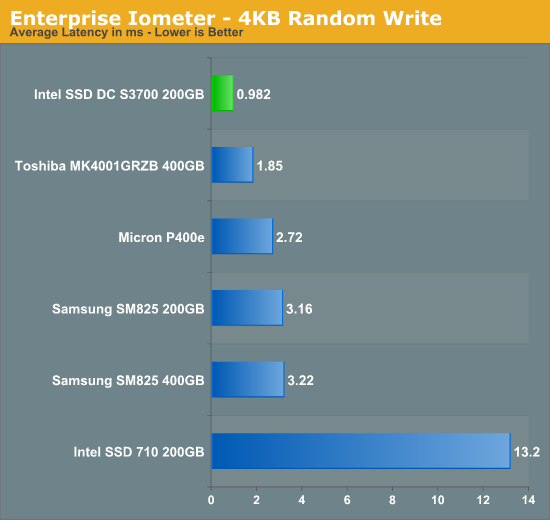
For the past few years we've been using 4KB random write performance as a measure of how advanced a controller is. Big multi-user (or virtualized) enterprise workloads almost always look fully random at a distance, which is why we use steady state random write performance as a key metric. The results below take hours to generate per drive and are truly an indication of steady state performance for 4KB random writes (100% LBA space):
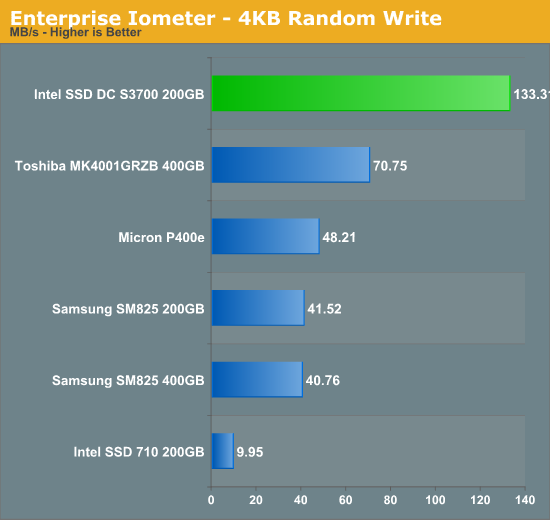
Most modern enterprise drives do a good job here. Drives from a few years ago couldn't cope with prolonged random write workloads, however the latest controllers have no issues sustaining high double or even triple digit transfer rates under heavy 4KB random writes. The graph above depicts steady state performance, which is honestly quite good for many of these enterprise drives. Intel's SSD DC S3700 obviously does very well here, but by looking at this graph alone we're really not doing the drive justice.
The next chart looks at max IO latency during this steady state 4KB random write workload:
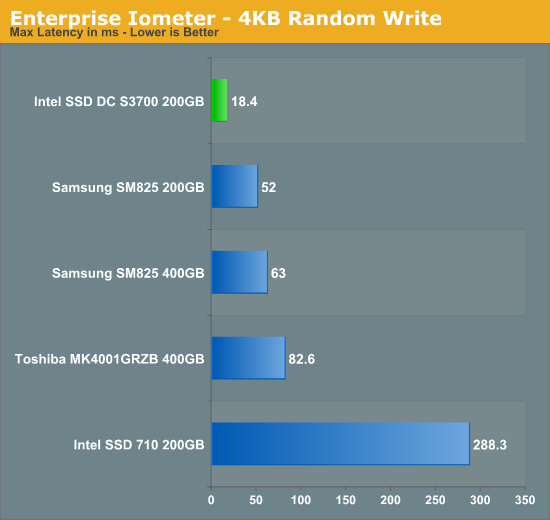
I had to pull Micron's P400e out of this graph because it's worst case latency was too high to be used without a logarithmic scale. The 710 actually boasts higher max latency than even a 15K RPM mechanical hard drive! If you remember back to the really bad JMicron drives from 5 years ago, they would deliver max latency well over 1 second at much lighter workloads. There are significant differences between the drives if you look at worst case latency, but the average latency for most of these drives tends to be ok:
The reason we haven't bothered with max IO latency in the past is because of what you see above. Average latency values are all pretty decent, indicating that despite the occasional high latency IO operation, things normally operate quite smoothly. Compared to a hard drive, even though some of these max latencies may even make an SSD temporarily slower than a hard drive, the overall SSD experience is still good enough to justify the move. The graphs above give us a couple of data points, but what we don't have a good idea of is just how different the S3700's behavior is over time. As is usually the case with big shifts in SSD architecture, we need a new way of looking at things.
To generate the data below I took a freshly secure erased SSD and filled it with sequential data. This ensures that all user accessible LBAs have data associated with them. Next I kicked off a 4KB random write workload at a queue depth of 32 using incompressible data. I ran the test for just over half an hour, no where near what we run our steady state tests for but enough to give me a good look at drive behavior once all spare area filled up.
I recorded instantaneous IOPS every second for the duration of the test. I then plotted IOPS vs. time and generated the scatter plots below. Each set of graphs features the same scale. The first two sets use a log scale for easy comparison, while the last set of graphs uses a linear scale that tops out at 40K IOPS for better visualization of differences between drives.
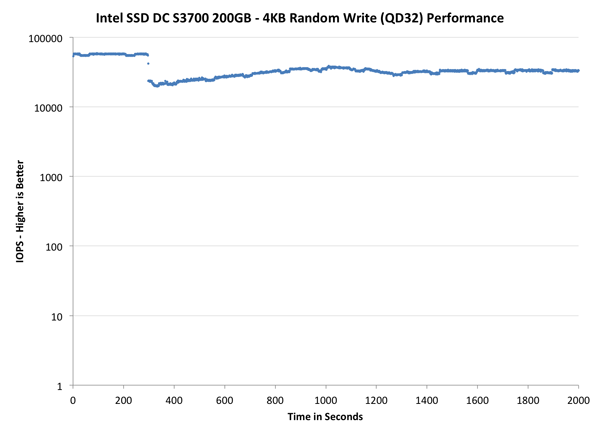
The first set of graphs shows the performance data over the entire 2000 second test period. In these charts you'll notice an early period of very high performance followed by a sharp dropoff. What you're seeing in that case is the drive alllocating new blocks from its spare area, then eventually using up all free blocks and having to perform a read-modify-write for all subsequent writes (write amplification goes up, performance goes down).
The second set of graphs zooms in to the beginning of steady state operation for the drive (t=1400s). The third set also looks at the beginning of steady state operation but on a linear performance scale. Click the buttons below each graph to switch source data.
Here we get an immediate feel for how all of these drives/controllers behave under heavy random writes. Although nearly all of the drives here are great average performers, variability among some is extremely high. The more variability, the less robust the drive's defrag/garbage collection algorithm is. If you click on the Intel SSD 710 you'll get a good feel for what's happening in these controllers.
The 710 has a very well defined performance trend. You see significant clustering of data points around what ends up being the drive's average performance over time. Performance is nice and tight early on while the 710 chews through its tremendous spare area, but even then you see occasional dips in IO performance. It's not super frequent, but it happens enough to be noticeable. Each one of those dots that appears significantly below the majority of the data points refers to when the Intel controller had to go off and defrag the drive (and/or indirection table) in order to keep performance high. You can tell that Intel's controller is always working, which helps keeps performance somewhat clustered but over time the controller seems to bite off more than it can chew and thus performance degrades.
The old X25-E looks almost consistent here, but that's partly because its performance is so low by modern standards. The other half of the X25-E story is that its performance is more consistent than most of the other drives. SLC NAND, especially at the 50nm generation, had very low program/erase latencies.
Note that the SandForce based Intel SSD 330 does very well here. I did use incompressible data both for the initial fill as well as for the random workload, however if you look at the tail end of the 330's curve you begin to see the drive lose its cool. SandForce's controller manages to do a good job, relatively speaking.
Moving down the list, Toshiba's SAS controller actually does a fairly good job here - once again thanks in part to its use of SLC NAND. Turning to Micron's P400e however, we have the other end of the spectrum. If you look at the overall performance curve there's a very tight distribution of IOPS as the P400e is able to quickly burn through clean blocks in its spare area. As most workloads won't see several minutes of sustained, high queue depth random writes, Micron's approach keeps performance for everyone else quite high. The controller doesn't appear to do a lot of clean up as it goes along, which is why it hits a performance wall once all spare area is consumed. The performance after that point is hugely variable. Some transactions complete at respectable rates while others effectively deliver dozens of IOPS.
Samsung's SSD 840 Pro, although a high-end client drive, gives us good insight into the next generation of Samsung enterprise drives. The 840 Pro's performance distribution isn't anywhere near as bad as the P400e's, but there's still at least an order of magnitude difference between the worst case and best case performance while running our test. I suspect that throwing more spare NAND at the problem would greatly help the 840 Pro.
Finally we get to the new Intel drive. Although the scale on this graph paints an ok picture for many drives at a high level, one look at Intel's SSD DC S3700 puts it all in perspective. While all drives show a scatter plot of IOPS, the S3700 draws a line. If your experience with SSDs is great minus the occasional drop in performance, it looksl ike the S3700 doesn't know how to hiccup. At a high level we see the same sort of behavior here as the other drives. Performance starts out very high as spare area is filled, there's a clear drop in performance as the S3700 adjusts to its new state (devoid of a large pool of clean blocks) but once we march towards steady state the S3700's performance is downright predictable.
The next set of charts look at the steady state (for most drives) portion of the curve. Here we'll get some better visibility into how everyone will perform over the long run.
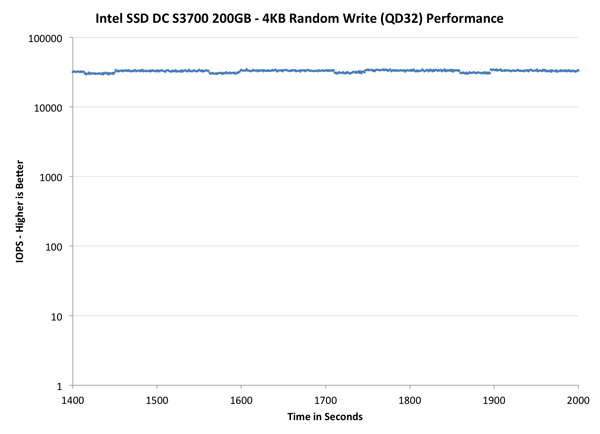
The source data is the same, we're just focusing on a different part of the graph. Once again the S3700's plot is effectively a line. The rest of the drives, including Intel's SSD 330 start to really show just how much their performance can vary from one transaction to the next.
The final set of graphs abandons the log scale entirely and just looks at a linear scale that tops out at 40K IOPS. We're also only looking at steady state (or close to it) performance here:
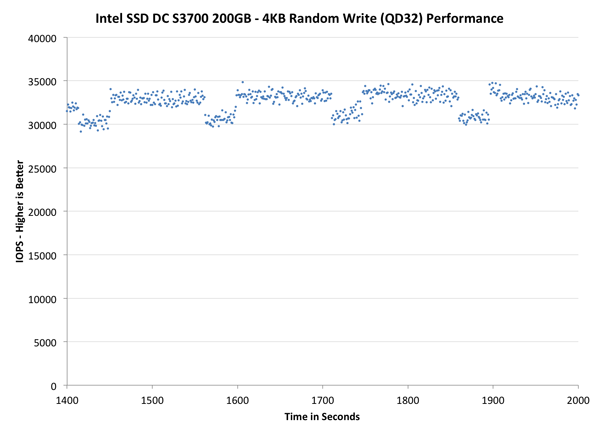
At this scale we can see the amount of variance the S3700 has to deal with. The highest value during this period for the S3700 is 34865 IOPS and the lowest value is 29150, a difference of just over 17%. Intel claims that you'll only see a variance of around 10 - 15% in its datasheets. We're a bit higher than that, but not by much. Looking at the S3700's graph you can pinpoint the frequency and duration of the new controller's big defrag/GC routines. Roughly every 150 seconds there's a tangible drop in performance where the controller is spending some of its cycles reorganizing its data in the physical space. The duration of the cleanup is short by comparison, roughly 30 - 40 seconds. These times will likely change depending on the workload. The 710 looks like an absolute mess by comparison. There's no clear cleanup period, which is likely because defragmenting both the indirection table and physical NAND ensure that the controller is always scrambling to restore performance. The 330 looks similarly scrambled. In fact, none of the other drives have the consistency that the S3700 delivers. I'm not going to go out on a limb and say that Intel's new controller is the only one that's this well behaved, but at least compared to this small sample set of controllers and drives its performance appears to be quite unique.
Implications for Enterprise & Client Users
The obvious impact from the S3700's performance in enterprise is that the drive should be much better behaved in large RAID arrays. With < 20% variation between min and max IOPS under steady state conditions (compared to gaps of 2x - 10x for older drives), overall performance should just improve. Heavily virtualized environments tend to look fully random in nature and they'll see big improvements in moving to the S3700. Even single drive environments will show much better behavior if the workload is random write heavy.
On the client side the improvements offered by the new S3700 controller are more subtle. Intel told me that it had to give up max performance in pursuit of consistency. We see that a bit if you look at our client focused Storage Bench suites. Samsung's SSD 840 Pro retains the overall performance crown (admittedly Intel's S3700 firmware is more optimized for enterprise workloads), but when it comes to IO consistency the S3700 can't be beat. For a client usage model (e.g. in a desktop or notebook) the impact of all of this is simply going to be fewer hiccups in normal use. Light workloads likely won't see any benefit especially if they're mostly read heavy, but the multitasking power users in the audience will likely appreciate the focus on consistency. I know through personal experience that I often encounter unexpectedly high IO latency at least several times a day on my personal machine (Samsung SSD 830). I would be willing to give up a bit of performance to get a more consistent experience. Although the S3700 isn't targeted at client systems, it's very likely that a future version will ship with non-HET 25nm MLC NAND (similar to the Intel SSD 710 vs 320). Given that the HET version of the drive is priced at $2.35 per GB, it's quite likely that we'll see Intel SSD 320 pricing (or perhaps a bit higher) for a lower endurance version.


30 Comments
View All Comments
RealNinja - Tuesday, November 6, 2012 - link
Looks like a nice enterprise drive. Will be interesting to see how reliable the new controller is in the "real world."For my consumer money...still gotta go with Samsung right now.
twtech - Tuesday, November 6, 2012 - link
Looks like a nice workstation drive as well. With that kind of write endurance, it should be able to handle daily multi-gigabyte content syncs.futrtrubl - Saturday, November 10, 2012 - link
Umm, with that write endurance it should be able to handle daily multi-TERAbyte syncs, seeing as it is rated at 10x capacity/day for 5 years.CeriseCogburn - Wednesday, January 2, 2013 - link
I watched the interview, and saw all 3 of the braggarts spew their personal fantasies and pride talk, then came here to take a look, and I'm not impressed.I do wonder how people do that.
DanNeely - Tuesday, November 6, 2012 - link
"I had to pull Micron's P400e out of this graph because it's worst case latency was too high to be used without a logarithmic scale. "Could you add the value to the text then?
crimson117 - Tuesday, November 6, 2012 - link
Move away from NAND - to what?stmok - Tuesday, November 6, 2012 - link
...To Phase Change Memory (PCM).DanNeely - Tuesday, November 6, 2012 - link
Everything old (CDRW) is new again!martixy - Friday, November 9, 2012 - link
Right... so we got that covered. :)Now we're eagerly awaiting the next milestone towards the tech singularity.
Memristor - Wednesday, November 7, 2012 - link
To Memristor