Corsair Neutron & Neutron GTX: All Capacities Tested
by Kristian Vättö on December 19, 2012 1:10 PM ESTPerformance Consistency
If you read our Exploring the Relationship Between Spare Area and Performance Consistency in Modern SSDs article, you have seen the performance consistency data for Neutron already and the data here should be nothing new. However, because we didn't have any performance consistency results in our initial Neutron review, I wanted to focus on it here.
We started paying attention to performance consistency when Intel launched the DC S3700 because Intel specifically highlighted its low latencies, which translate to consistent performance. Consistency has been a big selling point in the enterprise market for a long time now, but that has not yet transferred to the consumer SSD market. Given LAMD's enterprise focused history, I was eager to find out how the LM87800 would do in this regard.
To generate the data below I took a freshly secure erased SSD and filled it with compressible sequential data (incompressible for Intel SSD 335) . This ensures that all user accessible LBAs have data associated with them. Next I kicked off a 4KB random write workload at a queue depth of 32 using incompressible data. I ran the test for just over half an hour, no where near what we run our steady state tests for but enough to give me a good look at drive behavior once all spare area fills up.
I recorded instantaneous IOPS every second for the duration of the test. I then plotted IOPS vs. time and generated the scatter plots below. Each set of graphs features the same scale. The first two sets use a log scale for easy comparison, while the last set of graphs uses a linear scale that tops out at 40K IOPS for better visualization of differences between drives.
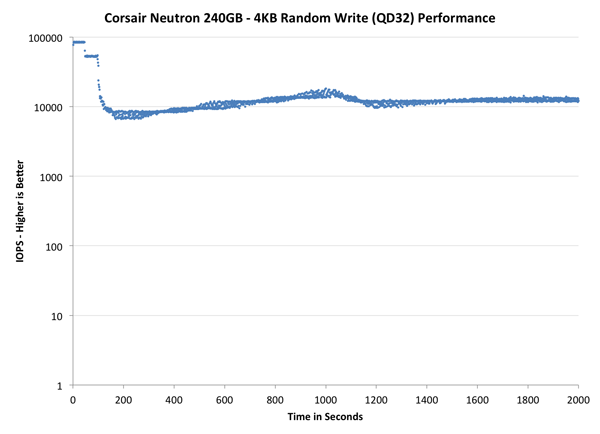
The first set of graphs shows the performance data over the entire 2000 second test period. In these charts you'll notice an early period of very high performance followed by a sharp dropoff. What you're seeing in that case is the drive alllocating new blocks from its spare area, then eventually using up all free blocks and having to perform a read-modify-write for all subsequent writes (write amplification goes up, performance goes down).
The second set of graphs zooms in to the beginning of steady state operation for the drive (t=1400s). The third set also looks at the beginning of steady state operation but on a linear performance scale. Click the buttons below each graph to switch source data.
The Neutron is extremely consistent. After the first burst, the performance variation is very small compared to for example OCZ Vector and Samsung SSD 840 Pro, although it should be noted that the Neutron comes with 12% over-provisioning by default while Vector and 840 Pro have only 7% of the capacity reserved for OP. The amount of OP can have an enormous effect on consistency but if that extra consistency is only due to the extra OP Corsair and LAMD has set aside, then it's been a great decision. Out of the consumer-grade drives, only Intel SSD 335 is more consistent but SandForce has always performed well when it comes to steady-state performance.
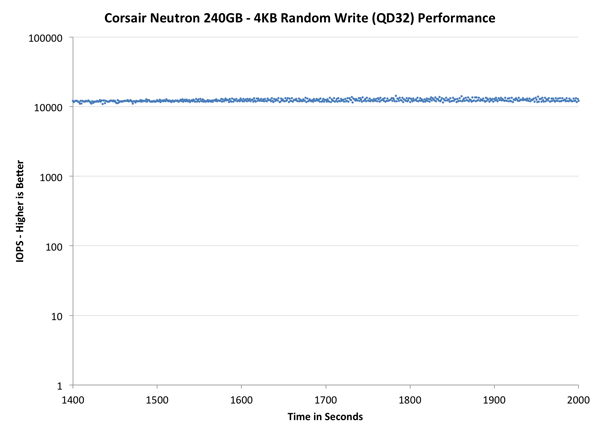
When focusing on the last 10 minutes of the test where most SSDs have reached steady state, the Neutron is exceptional. While all other SSDs in this test including the enterprise focused Intel S3700 have noticeably variation in IOPS, the Neutron does not. The variation is only around 2-3K IOPS, whereas for Intel SSD 335 it's up to 25K IOPS. The steady state performance in general is also great; Vector and 840 Pro have an average IOPS of ~5-8K while the Neutron manages to push 12-13K IOPS. Intel DC S3700 is obviously in its own class but again, keep in mind that it also has significantly more OP than the other SSDs in this test. When the Neutron is given about as much OP as the S3700, they perform about the same.
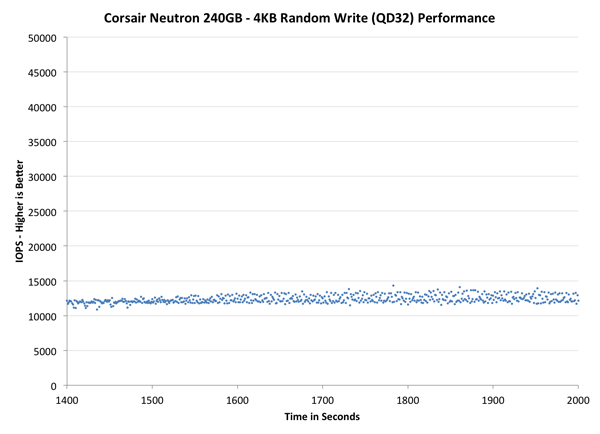
Neutron's ability to retain performance and consistency over time is definitely appreciated and it's the most consistent consumer-grade SSD at the default OP we have tested. SandForce based SSDs can push much higher peak IOPS but the variation is in the magnitude of tens of thousands of IOPS. While the SSD 335 has higher IOPS on average, it drops below 10K right after 30 minutes of 4KB random writes but the Neutron is able to sustain a throughput of 12-13K throughout the last ten minutes of the test.


44 Comments
View All Comments
Oxford Guy - Sunday, December 23, 2012 - link
Ad hominem much?Plenty of buyers would be interested in knowing that the 830, for instance, tops the charts in terms of power usage under load, particularly given the fact that Samsung's "full specs" advertised number is impossibly low.
People have been tricked by this, which is exactly why Samsung publishes that low number.
Ever heard of laptop battery life? What about heat? I suppose not.
Kristian Vättö - Saturday, December 22, 2012 - link
The figures Samsung reports are with Device Initiated Power Management (DIPM) enabled. That's a feature that is usually only found on laptops but it can be added to desktop systems as well.With DIPM disabled, Samsung rates the idle power at 0.349W, which supports our figures (we got 0.31W).
The same goes for active power, Samsung rates it at 3.55W (sequential write) and 2.87W (4KB random write QD32). The 0.069W figure comes from the average power draw using Mobile Mark 2007, which is something we don't use.
Oxford Guy - Sunday, December 23, 2012 - link
So, in a laptop, the load power for the 830 amazingly plummets from, what 5+ watts, to .13 watts?That's really amazing. I guess the next thing to ask is why these amazing results aren't part of the published charts.
Cold Fussion - Saturday, December 22, 2012 - link
I think the power consumption tests are particularly useless. How come you don't test power consumption under some typical workload and heavy workload so we can see how much energy they use?Kristian Vättö - Sunday, December 23, 2012 - link
Because we don't have the equipment for that. With a standard multimeter we can only record the average peak current, so we have to use an IOmeter test for each number (recording the peak while running e.g. Heavy suite would be useless).Good power measurement equipment can cost thousands of dollars. Ultimately the decision is up to Anand but I don't think he is willing to spend that much money on just one test, especially when it can somewhat be tested with a standard multimeter. Besides, desktop users don't usually care about the power consumption at all, so that is another reason why such investment might not be the most worthwhile.
Oxford Guy - Sunday, December 23, 2012 - link
And we know only desktop users buy SSDs. No one ever buys them for laptops.lmcd - Monday, December 24, 2012 - link
Howabout you buy the equipment for them, if it's such a great investment?Cold Fussion - Tuesday, December 25, 2012 - link
That line of thinking is flawed. If you're only catering to desktop users, why even present the power consumption figures at all? The 3-5w maximum power consumption of an SSD which will largely be idle is not at all significant compared to the 75 watts the cpu is pulling while gaming or the 150watts the gpu is pulling.The tests as they are server no real purpose. It would be like trying to measure power-efficiency of a cpu purely by it's maximum power consumption. I don't believe a basic datalogger is going to run into the 1000s.
Kristian Vättö - Tuesday, December 25, 2012 - link
I didn't say we only cater desktop users, but the fact is that some of our readers are desktop users and hence don't care about the power consumption tests. It's harder to justify buying expensive equipment when some will not be interested in the tests.Don't get me wrong, I would buy the equipment in a heartbeat if someone gave me the money. However, I'm not the one pulling the strings on that. If you have suggestions on affordable dataloggers, feel free to post them. All I know is that the tool that was used in the Clover Trail efficiency article costs around $3000.
Cold Fussion - Tuesday, December 25, 2012 - link
But it doesn't cater to mobile users because the data provided is simply not of any real use. I can go to my local retail electronics store and buy a data-logging multimeter for $150-$250 AUD, I am almost certain that you can purchase one cheaper than that in the US from a retail outlet or online.