Intel SSD 335 (240GB) Review
by Kristian Vättö on October 29, 2012 11:30 AM ESTAnandTech Storage Bench 2011—Light Workload
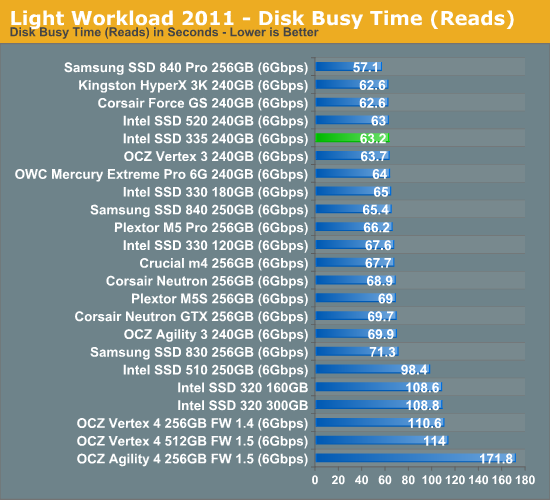
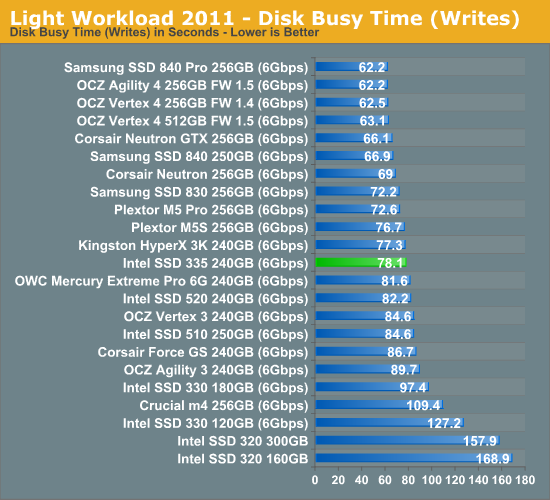
Our new light workload actually has more write operations than read operations. The split is as follows: 372,630 reads and 459,709 writes. The relatively close read/write ratio does better mimic a typical light workload (although even lighter workloads would be far more read centric).
The I/O breakdown is similar to the heavy workload at small IOs, however you'll notice that there are far fewer large IO transfers:
| AnandTech Storage Bench 2011—Light Workload IO Breakdown | ||||
| IO Size | % of Total | |||
| 4KB | 27% | |||
| 16KB | 8% | |||
| 32KB | 6% | |||
| 64KB | 5% | |||
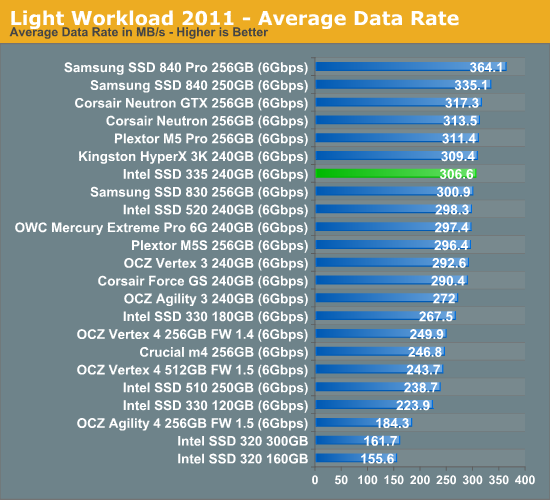
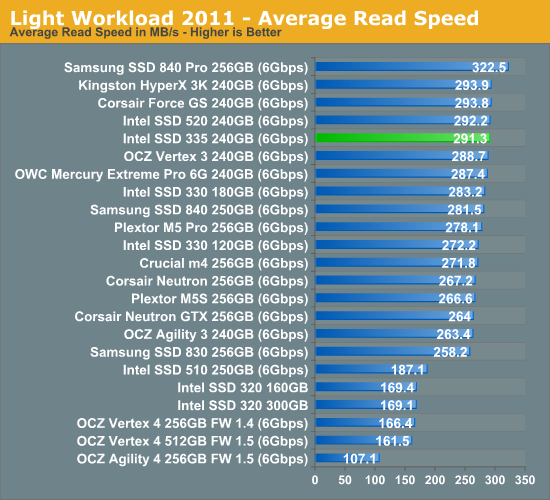
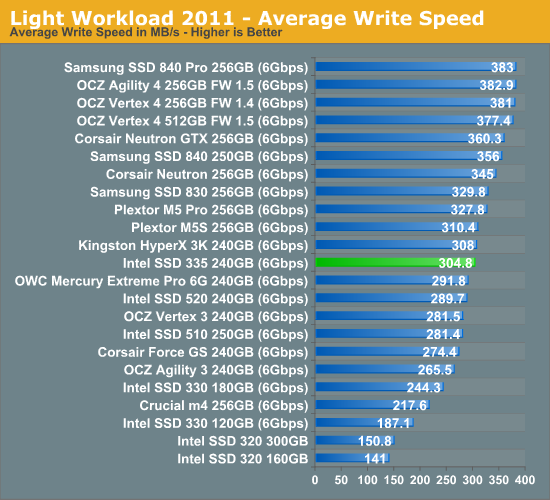
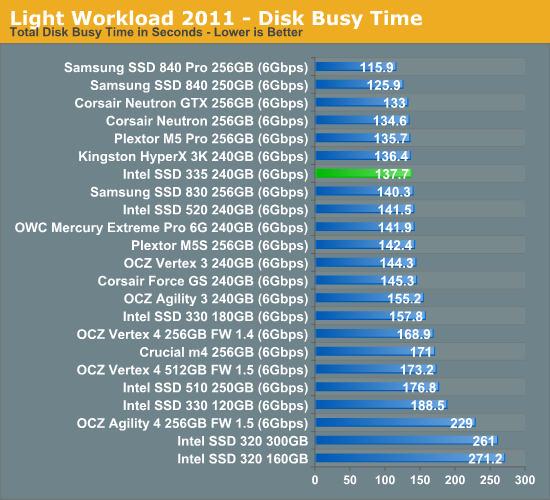
Performance in our Light suite is as strong as it is in the Heavy suite; the SSD 335 is again faster than the 520 and 330.


69 Comments
View All Comments
Per Hansson - Tuesday, October 30, 2012 - link
No, it does not work like that.A slow DMM might take a reading every second.
An example, in seconds:
1: 2w
2: 2w
3: 2w
Average=2w
A fast DMM might take readings every 100ms:
1: 2w
2: 0.5w
3: 2w
4: 0.5w
Average=1w
As you see a DMM does not take a continous reading, it takes readings at points in time and averages those...
An SSD drive might actually change power levels much more frequently, like every millisencond (consider their performance, how long does it take to write 4KB of data as an example?)
hrga - Thursday, November 1, 2012 - link
dont think SSD even try to write such a small amount of data as 4kB every milisecond considering how large buffers usually have 128GB LPDDR2. So thes kind of small writes occur in bursts when they accumulate every 15-30s (at least hope so as this was case with hard drives) That ofc depends on firmware and values in it.Per Hansson - Thursday, November 1, 2012 - link
That makes no difference, I sincerely hope that no drive waits 15 > 30 seconds to write data to disk because that is just a recipe for data loss in case of power failure or BSOD.I also hope no drive uses a 128GB write cache. (Intel's in house controller keeps no user data in cache as an example, but I digress)
Even if the drive waits a minute before it writes the 4KB of data you must still have a DMM capable of catching that write, which is completed in less than a millisecond.
Otherwise the increased power consumption during the disk write will be completely missed by the DMM
Mr Alpha - Monday, October 29, 2012 - link
Wouldn't it make more sense to the idle power consumption on a platform that supports DPIM? The idle power usage is mostly a matter on mobile devices, and it is on those you get DPIM support.sheh - Monday, October 29, 2012 - link
The text says total writes were 1.2TB, (+3.8TB=) 5TB, and 37.8TB. The screenshots show "host writes" at 1.51TB, 2.11TB, and 3.90TB?sheh - Monday, October 29, 2012 - link
And why the odd power on hours counts?Kristian Vättö - Monday, October 29, 2012 - link
You are mixing host writes with the actual NAND writes. Host writes are the data that the host (e.g. an operating system) sends to the SSD controller to write. NAND writes show much is written to the NAND.When the SSD is pushed to a corner like I did, you will end up having more NAND writes than host writes because of read-modify-write (i.e. all user-accessible LBAs are already full, so the controller must read the block to a cache, modify the data and rewrite the block). Basically, your host may be telling the controller to write 4KB but the controller ends up writing 2048MB (that's the block size).
extide - Monday, October 29, 2012 - link
Block size is 2048KB*sheh - Monday, October 29, 2012 - link
So the write amplification in the end was x9.7?Are NAND writes also reported by SMART?
And with the messed up power on count, how can you know the rest of the SMART data is reliable?
Kristian Vättö - Tuesday, October 30, 2012 - link
Yes, write amplification was around 9.7x in the end. That makes sense because the drive becomes more and more fragmented the more you write to it.As you can see in the screenshots, the SMAT value F9 corresponds to NAND writes. Most manufacturers don't report this data, though.
We just have to assume that the values are correct. Otherwise we could doubt every single test result we get, which would make reviewing impossible. The data makes sense so at least it's not screaming that something is off, and from what I have read, we aren't the only site who noticed weird endurance behavior.