OCZ Vector (256GB) Review
by Anand Lal Shimpi on November 27, 2012 9:10 PM ESTSequential Read/Write Speed
To measure sequential performance I ran a 1 minute long 128KB sequential test over the entire span of the drive at a queue depth of 1. The results reported are in average MB/s over the entire test length.
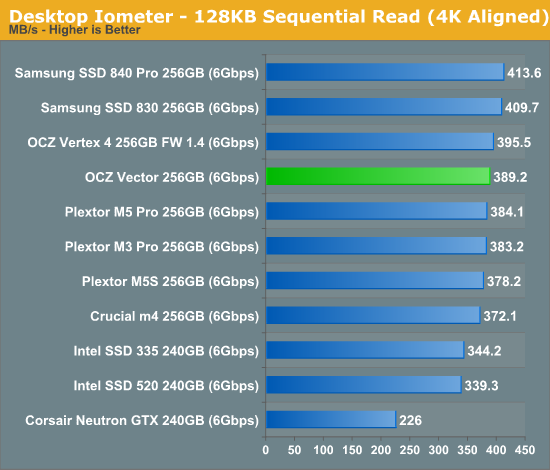
Low queue depth sequential read performance is among the better drives, but still slightly behind Samsung.
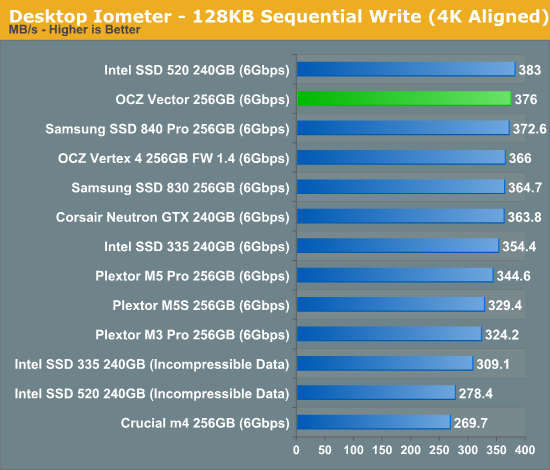
Write performance continues to be the Vector's strong suit, here only Intel's SSD 520 with easily compressed data pulls ahead.
AS-SSD Incompressible Sequential Performance
The AS-SSD sequential benchmark uses incompressible data for all of its transfers. The result is a pretty big reduction in sequential write speed on SandForce based controllers.
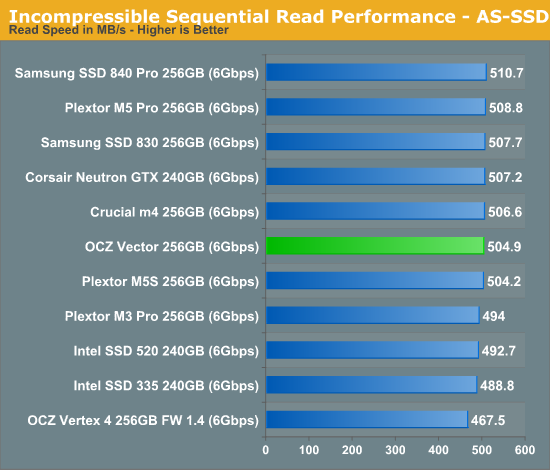
High queue depth sequential IO shows significant clustering at the top of the charts thanks to the limits of 6Gbps SATA. The Vector pushes performance pretty much as fast as possible here.
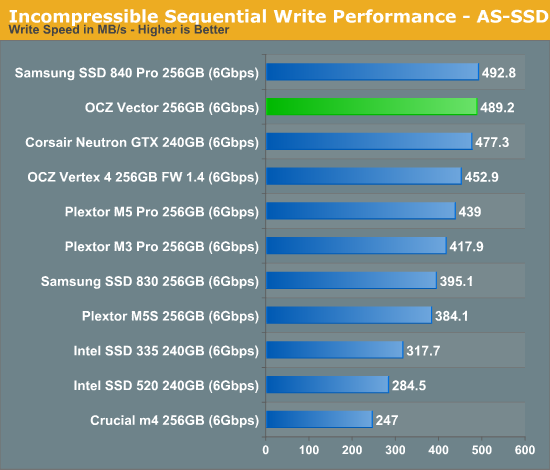
Switching to writes does shake loose some of the weaker competitors, but the Vector and 840 Pro still emerge as the strongest. Corsair's Neutron GTX does very well here.


151 Comments
View All Comments
dj christian - Thursday, November 29, 2012 - link
What is SZ80/100 in the graphs, what do they stand for?Anand Lal Shimpi - Wednesday, November 28, 2012 - link
You are correct, I ran a 100% span of the 4KB/QD32 random write test. The right way to do this test is actually to gather all IO latency data until you hit steady state, which you can usually do on most consumer drives after just a couple of hours of testing. The problem is the resulting dataset ends up being a pain to process and present.There is definitely a correlation between spare area and IO consistency, particularly on drives that delay their defragmentation routines quite a bit. If you look at the Intel SSD 710 results you'll notice that despite having much more spare area than the S3700, consistency is clearly worse.
As your results show though, for an emptier drive IO consistency isn't as big of a problem (although if you continued to write to it you'd eventually see the same issues as all of that spare area would get used up). I think there's definitely value in looking at exactly what you're presenting here. The interesting aspect to me is this tells us quite a bit about how well drives make use of empty LBA ranges.
I tend to focus on the worst case here simply because that ends up being what people notice the most. Given that consumers are often forced into a smaller capacity drive than they'd like, I'd love to encourage manufacturers to pursue architectures that can deliver consistent IO even with limited spare area available.
Take care,
Anand
jwilliams4200 - Wednesday, November 28, 2012 - link
Anand wrote:"As your results show though, for an emptier drive IO consistency isn't as big of a problem (although if you continued to write to it you'd eventually see the same issues as all of that spare area would get used up)."
Actually, all of my tests did use up all the spare area, and had reached steady state during the graph shown. Perhaps you have misunderstood how I did my tests. I just overprovisioned it so that it had almost as much spare area as the Intel S3700. Otherwise, I was doing the same thing as you did in your tests.
The conclusion to be drawn is that the Intel S3700 is not all that special. You can approach the same performance as the S3700 with a consumer SSD, at least with a Samsung 840 Pro, just by overprovisioning enough.
Look at this one again:
http://i.imgur.com/Vvo1H.png
It reaches steady state somewhere between 80 and 120GB. The spare area is used up at about 62GB and the speed drops precipitously, but then there is a span where the speed actually increases slightly, and then levels out somewhere around 80-120GB.
Note that steady state is about 110MB/sec. That is about 28K IOPS. Not as good as the Intel S3700, but certainly approaching it.
Ictus - Wednesday, November 28, 2012 - link
Hey J, thanks for taking the time to reply to me in the other comment.I think my question is even more noobish than you have assumed.
"I just overprovisioned it so that it had almost as much spare area as the Intel S3700. Otherwise, I was doing the same thing as you did in your tests."
I am confused because I thought the only way to "over-provision" was to create a partition that didn't use all the available space??? If you are merely writing raw data up to the 80% full level, what exactly does over provisioning mean? Does the term "over provisioning" just mean you didn't fill the entire drive, or you did something to the drive?
jwilliams4200 - Wednesday, November 28, 2012 - link
No, overprovisioning generally just means that you avoid writing to a certain range of LBAs (aka sectors) on the SSD. Certainly one way to do that is to create a partition smaller than the capacity of the SSD. But that is completely equivalent to writing to the raw device but NOT writing to a certain range of LBAs. The key is that if you don't write to certain LBAs, however that is accomplished, then the SSD's flash translation table (FTL) will not have any mapping for those LBAs, and some or all SSDs will be smart enough to use those unmapped-LBAs as spare area to improve performance and wear-leveling.So no, I did not "do something to the drive". All I did was make sure that fio did not write to any LBAs past the 80% mark.
gattacaDNA - Sunday, December 2, 2012 - link
"The conclusion to be drawn is that the Intel S3700 is not all that special. You can approach the same performance as the S3700 with a consumer SSD, at least with a Samsung 840 Pro, just by overprovisioning enough."WOW - this is an interesting discussion which concludes that by simply over-provisioning a consumer SSD by 20-30% those units can approach the vetted S3700! I had to re-read those posts 2x to be sure I read that correctly.
It seems some later posts state that if the workload is not sustained (drive can recover) and the drive is not full, that the OP has little to no benefit.
So is an best bang really just not fill the drives past 75% of the available area and call it a day?
jwilliams4200 - Sunday, December 2, 2012 - link
The conclusion I draw from the data is that if you have a Samsung 840 Pro (or similar SSD, I believe several consumer SSDs behave similarly with respect to OP), and the big one -- IF you have a very heavy, continuous write workload, then you can achieve large improvements in throughput and huge improvements in maximum latency if you overprovision at 80% (i.e., leave 20% unwritten or unpartitioned)Note that such OP is not needed for most desktop users, for two reasons. First, most desktop users will not fill the drive 100% and as long as they have TRIM working, and if the drive is only filled to 80% (even if the filesystem covers all 100%), then it should behave as if it were actually overprovisioned at 80%. Second, most desktop users do not continuously write tens of Gigabytes of data without pause.
gattacaDNA - Sunday, December 2, 2012 - link
Thank You. That's what my take-away is as well.jwilliams4200 - Wednesday, November 28, 2012 - link
By the way, I am not sure why you say the data sets are "a pain to process and present". I have written some test scripts to take the data automatically and to produce the graphs automatically. I just hot-swap the SSD in, run the script, and then come back when it is done to look at the graphs.Also, the best way to present latency data is in a cumulative distribution function (CDF) plot with a normal probability scale on the y-axis, like this:
http://i.imgur.com/RcWmn.png
http://i.imgur.com/arAwR.png
One other tip is that it does not take hours to reach steady state if you use a random map. This means that you do a random write to all the LBAs, but instead of sampling with replacement, you keep a map of the LBAs you have already written to and don't randomly select the same ones again. In other words, write each 4K-aligned LBA on a tile, put all the tiles in a bag, and randomly draw the tiles out but do not put the drawn tile back in before you select the next tile. I use the 'fio' program to do this. With an SSD like the Samsung 840 Pro (or any SSD than can do 300+ MB/s 4KQD32 random writes), you only have to write a little more than the capacity of the SSD (eg., 256GB + 7% of 256GB) to reach steady state. This can be done in 10 or 20 minutes on fast SSDs.
Brahmzy - Wednesday, November 28, 2012 - link
I consistently over-provision every single SSD I use by at least 20%. I have had stellar performance doing this with 50-60+ SSDs over the years.I do this on friend's/family's builds and tell anybody I know to do this with theirs. So, with my tiny sample here, OP'ing SSDs is a big deal, and it works. I know many others do this as well. I base my purchase decisions with OP in mind. If I need 60GB of space, I'll buy a 120GB. If I need 120GB of usable space, I'll buy a 250GB drive, etc.
I think it would be valuable addition to the Anand suite of tests to account for this option that many of us use. Maybe a 90% OP write test and maybe an 80% OP write test. Assuming there's a constitent difference between the two.