Samsung SSD 840 Pro (256GB) Review
by Anand Lal Shimpi on September 24, 2012 7:00 AM EST- Posted in
- Storage
- SSDs
- Samsung
- Samsung SSD 840
AnandTech Storage Bench 2011
Two years ago we introduced our AnandTech Storage Bench, a suite of benchmarks that took traces of real OS/application usage and played them back in a repeatable manner. I assembled the traces myself out of frustration with the majority of what we have today in terms of SSD benchmarks.
Although the AnandTech Storage Bench tests did a good job of characterizing SSD performance, they weren't stressful enough. All of the tests performed less than 10GB of reads/writes and typically involved only 4GB of writes specifically. That's not even enough exceed the spare area on most SSDs. Most canned SSD benchmarks don't even come close to writing a single gigabyte of data, but that doesn't mean that simply writing 4GB is acceptable.
Originally I kept the benchmarks short enough that they wouldn't be a burden to run (~30 minutes) but long enough that they were representative of what a power user might do with their system.
Not too long ago I tweeted that I had created what I referred to as the Mother of All SSD Benchmarks (MOASB). Rather than only writing 4GB of data to the drive, this benchmark writes 106.32GB. It's the load you'd put on a drive after nearly two weeks of constant usage. And it takes a *long* time to run.
1) The MOASB, officially called AnandTech Storage Bench 2011 - Heavy Workload, mainly focuses on the times when your I/O activity is the highest. There is a lot of downloading and application installing that happens during the course of this test. My thinking was that it's during application installs, file copies, downloading and multitasking with all of this that you can really notice performance differences between drives.
2) I tried to cover as many bases as possible with the software I incorporated into this test. There's a lot of photo editing in Photoshop, HTML editing in Dreamweaver, web browsing, game playing/level loading (Starcraft II & WoW are both a part of the test) as well as general use stuff (application installing, virus scanning). I included a large amount of email downloading, document creation and editing as well. To top it all off I even use Visual Studio 2008 to build Chromium during the test.
The test has 2,168,893 read operations and 1,783,447 write operations. The IO breakdown is as follows:
| AnandTech Storage Bench 2011 - Heavy Workload IO Breakdown | ||||
| IO Size | % of Total | |||
| 4KB | 28% | |||
| 16KB | 10% | |||
| 32KB | 10% | |||
| 64KB | 4% | |||
Only 42% of all operations are sequential, the rest range from pseudo to fully random (with most falling in the pseudo-random category). Average queue depth is 4.625 IOs, with 59% of operations taking place in an IO queue of 1.
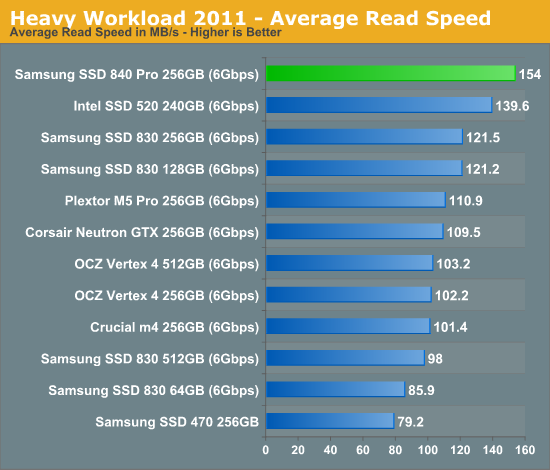
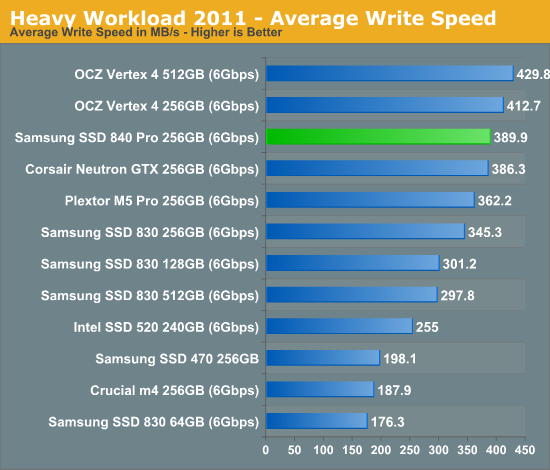
Many of you have asked for a better way to really characterize performance. Simply looking at IOPS doesn't really say much. As a result I'm going to be presenting Storage Bench 2011 data in a slightly different way. We'll have performance represented as Average MB/s, with higher numbers being better. At the same time I'll be reporting how long the SSD was busy while running this test. These disk busy graphs will show you exactly how much time was shaved off by using a faster drive vs. a slower one during the course of this test. Finally, I will also break out performance into reads, writes and combined. The reason I do this is to help balance out the fact that this test is unusually write intensive, which can often hide the benefits of a drive with good read performance.
There's also a new light workload for 2011. This is a far more reasonable, typical every day use case benchmark. Lots of web browsing, photo editing (but with a greater focus on photo consumption), video playback as well as some application installs and gaming. This test isn't nearly as write intensive as the MOASB but it's still multiple times more write intensive than what we were running in 2010.
As always I don't believe that these two benchmarks alone are enough to characterize the performance of a drive, but hopefully along with the rest of our tests they will help provide a better idea.
The testbed for Storage Bench 2011 has changed as well. We're now using a Sandy Bridge platform with full 6Gbps support for these tests.
AnandTech Storage Bench 2011 - Heavy Workload
We'll start out by looking at average data rate throughout our new heavy workload test:
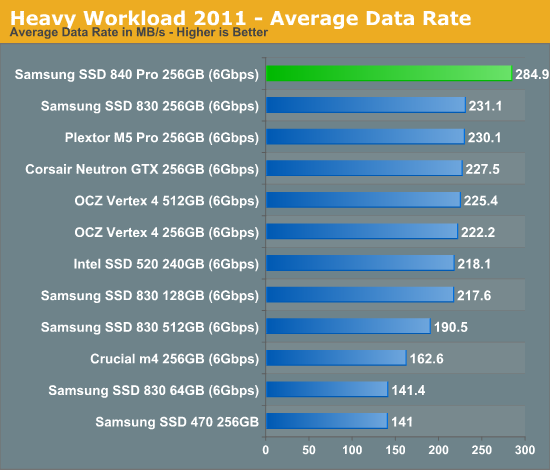
A strong showing in all of our low level IO tests, with no drawbacks, results in 24% better performance than the 830 in our heavy workload. There's simply no faster drive than the 840 Pro.
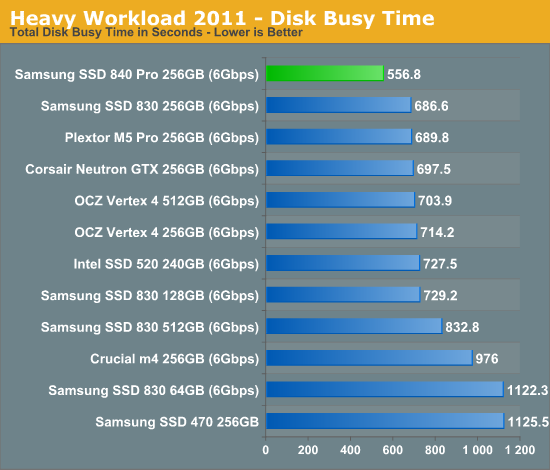
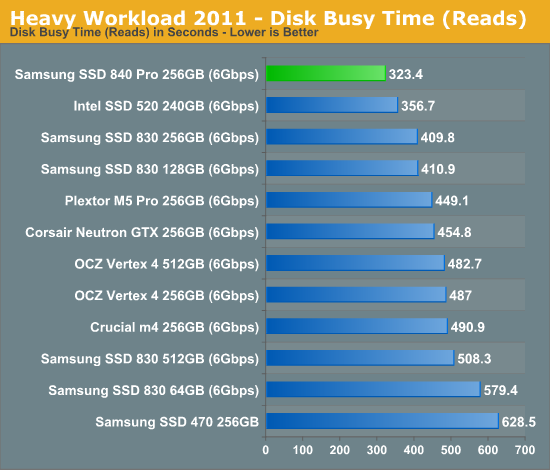
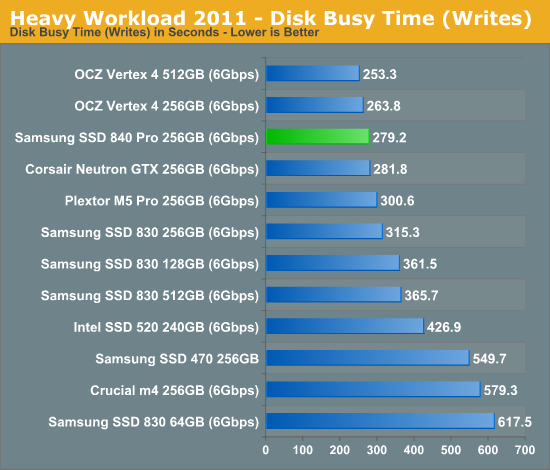
The next three charts just represent the same data, but in a different manner. Instead of looking at average data rate, we're looking at how long the disk was busy for during this entire test. Note that disk busy time excludes any and all idles, this is just how long the SSD was busy doing something:


96 Comments
View All Comments
B3an - Tuesday, September 25, 2012 - link
When will you guys have the 840 Pro added to Bench?Kristian Vättö - Thursday, September 27, 2012 - link
Here you go: http://www.anandtech.com/bench/Product/665hrrmph - Tuesday, September 25, 2012 - link
On the recent SSD reviews, thanks for taking the time to let us know about the tool box utilities!!
After years of using OCZ, I just deployed my first Intel 520 a month ago. It's a solid 'no hiccup' performer so far.
Now that the 840 Pro makes Samsung competitive with the best SSDs on performance, warranty, and utilities, I look forward to trying it out.
I particularly like the idea of being able to use the Samsung Magician software to set the spare area. All of my machines have other drives for bulk data, so being able to allocate some unused space on the SSD for use as spare area seems logical.
-
zer0sum - Tuesday, September 25, 2012 - link
Why are some SSD tests on AT being run with Z68, 2500k @ 3.3ghz with turbo and EIST enabled, 1600Mhz ram, and then this one with H67, 2600k @ 3.4 with turbo and EIST disabled, and 1333Mhz ram?Does this effect performance in any of the tests?
Per Hansson - Tuesday, September 25, 2012 - link
It very well might, EIST has been known to cause problems for SSD's in the past.Also would be very interesting to hear Anands thoughts on the power consumption concerns raised above (DIPM: Device Initiated Power Management)
Per Hansson - Tuesday, September 25, 2012 - link
A quick Google shows the first link to Anandtech's own forums, and a quite good confirmation that EIST affects performance by a quite noticeable margin!http://www.google.co.uk/search?hl=en&q=eist+ss...
zer0sum - Tuesday, September 25, 2012 - link
Ok, I had lower than expected 4k write scores with my 3570k @4.5ghz, using EIST and turbo mode so I went with some advice and ran a single thread of prime95 whilst doing an AS-SSD run.Big difference!!
http://www.overclock.net/t/1242088/official-vertex...
mr. president - Tuesday, September 25, 2012 - link
Nice review. I'd still want to see more 'exotic' use cases tested and especially ones that test garbage collection where TRIM isn't available.ZiL ZFS and software RAID spring to mind. Or, from a more consumer oriented standpoint, the PS3 can benefit from an SSD but it has no TRIM support.
serpretetsky - Wednesday, September 26, 2012 - link
"Assuming the premature death of our review sample was a fluke and not indicative of a bigger issue,"Care to elaborate on this? It simply failed after you guys ran all the tests on it?
Is there any way you guys might get another sample and run it through the same (or harder) tests?
Thanks for the review, you guys are awesome.
capeconsultant - Wednesday, September 26, 2012 - link
I second this request :)