Samsung SSD 840 Pro (256GB) Review
by Anand Lal Shimpi on September 24, 2012 7:00 AM EST- Posted in
- Storage
- SSDs
- Samsung
- Samsung SSD 840
AnandTech Storage Bench 2011
Two years ago we introduced our AnandTech Storage Bench, a suite of benchmarks that took traces of real OS/application usage and played them back in a repeatable manner. I assembled the traces myself out of frustration with the majority of what we have today in terms of SSD benchmarks.
Although the AnandTech Storage Bench tests did a good job of characterizing SSD performance, they weren't stressful enough. All of the tests performed less than 10GB of reads/writes and typically involved only 4GB of writes specifically. That's not even enough exceed the spare area on most SSDs. Most canned SSD benchmarks don't even come close to writing a single gigabyte of data, but that doesn't mean that simply writing 4GB is acceptable.
Originally I kept the benchmarks short enough that they wouldn't be a burden to run (~30 minutes) but long enough that they were representative of what a power user might do with their system.
Not too long ago I tweeted that I had created what I referred to as the Mother of All SSD Benchmarks (MOASB). Rather than only writing 4GB of data to the drive, this benchmark writes 106.32GB. It's the load you'd put on a drive after nearly two weeks of constant usage. And it takes a *long* time to run.
1) The MOASB, officially called AnandTech Storage Bench 2011 - Heavy Workload, mainly focuses on the times when your I/O activity is the highest. There is a lot of downloading and application installing that happens during the course of this test. My thinking was that it's during application installs, file copies, downloading and multitasking with all of this that you can really notice performance differences between drives.
2) I tried to cover as many bases as possible with the software I incorporated into this test. There's a lot of photo editing in Photoshop, HTML editing in Dreamweaver, web browsing, game playing/level loading (Starcraft II & WoW are both a part of the test) as well as general use stuff (application installing, virus scanning). I included a large amount of email downloading, document creation and editing as well. To top it all off I even use Visual Studio 2008 to build Chromium during the test.
The test has 2,168,893 read operations and 1,783,447 write operations. The IO breakdown is as follows:
| AnandTech Storage Bench 2011 - Heavy Workload IO Breakdown | ||||
| IO Size | % of Total | |||
| 4KB | 28% | |||
| 16KB | 10% | |||
| 32KB | 10% | |||
| 64KB | 4% | |||
Only 42% of all operations are sequential, the rest range from pseudo to fully random (with most falling in the pseudo-random category). Average queue depth is 4.625 IOs, with 59% of operations taking place in an IO queue of 1.
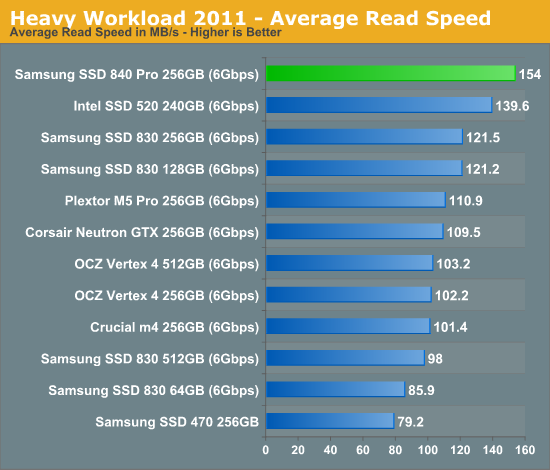
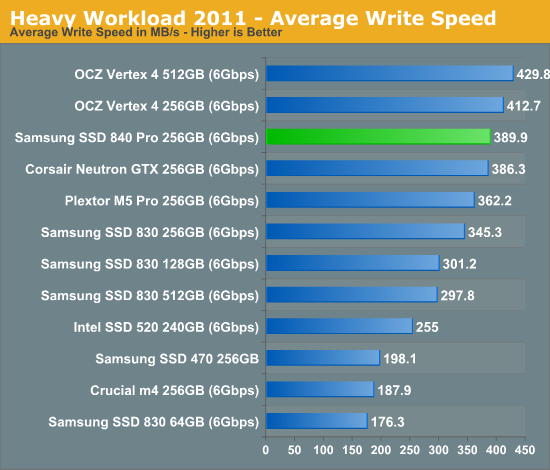
Many of you have asked for a better way to really characterize performance. Simply looking at IOPS doesn't really say much. As a result I'm going to be presenting Storage Bench 2011 data in a slightly different way. We'll have performance represented as Average MB/s, with higher numbers being better. At the same time I'll be reporting how long the SSD was busy while running this test. These disk busy graphs will show you exactly how much time was shaved off by using a faster drive vs. a slower one during the course of this test. Finally, I will also break out performance into reads, writes and combined. The reason I do this is to help balance out the fact that this test is unusually write intensive, which can often hide the benefits of a drive with good read performance.
There's also a new light workload for 2011. This is a far more reasonable, typical every day use case benchmark. Lots of web browsing, photo editing (but with a greater focus on photo consumption), video playback as well as some application installs and gaming. This test isn't nearly as write intensive as the MOASB but it's still multiple times more write intensive than what we were running in 2010.
As always I don't believe that these two benchmarks alone are enough to characterize the performance of a drive, but hopefully along with the rest of our tests they will help provide a better idea.
The testbed for Storage Bench 2011 has changed as well. We're now using a Sandy Bridge platform with full 6Gbps support for these tests.
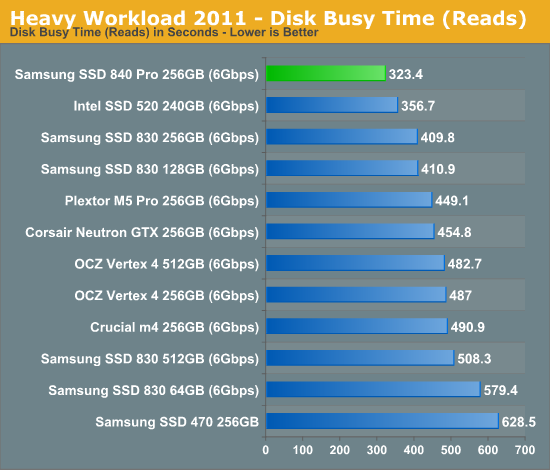
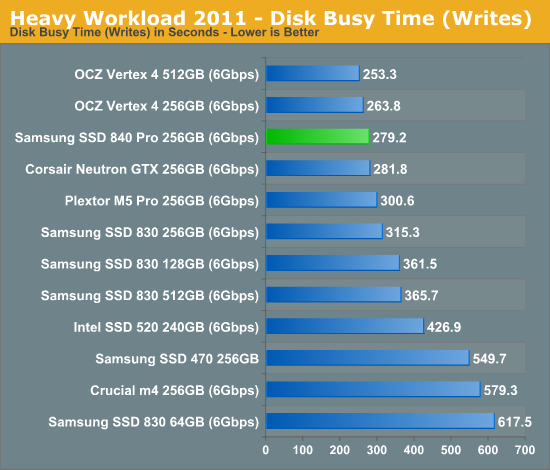
AnandTech Storage Bench 2011 - Heavy Workload
We'll start out by looking at average data rate throughout our new heavy workload test:
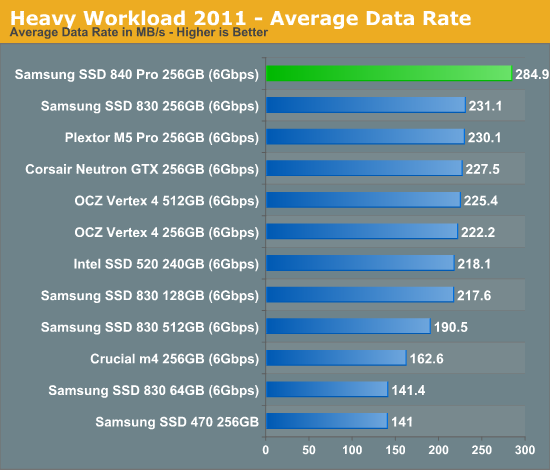
A strong showing in all of our low level IO tests, with no drawbacks, results in 24% better performance than the 830 in our heavy workload. There's simply no faster drive than the 840 Pro.
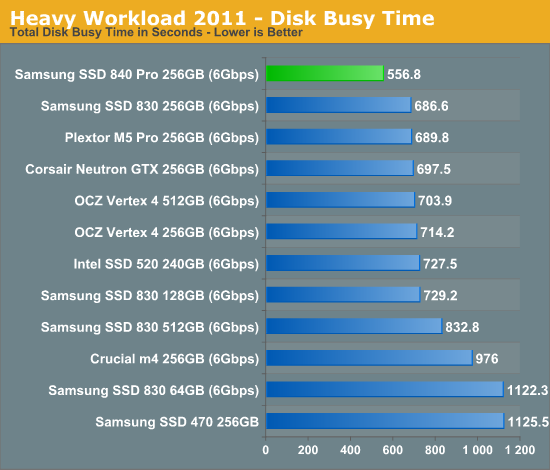
The next three charts just represent the same data, but in a different manner. Instead of looking at average data rate, we're looking at how long the disk was busy for during this entire test. Note that disk busy time excludes any and all idles, this is just how long the SSD was busy doing something:


96 Comments
View All Comments
stoked - Monday, September 24, 2012 - link
Do these drives include power loss protection like the Intel 320's?Kristian Vättö - Monday, September 24, 2012 - link
Simply and shortly, no. However, Samsung showed a few enterprise SSDs as well, which may have (they were simply on display, so I'm not sure).lunadesign - Monday, September 24, 2012 - link
Anand - How does this drive do in cases where TRIM isn't an option? How does it compare to the M5 Pro in this area?kpo6969 - Monday, September 24, 2012 - link
Anand- If you only had a choice of two drives to put in your own system would you go with this one or the Plextor M5 Pro? Just wondering, thanks.Zoomer - Monday, September 24, 2012 - link
However, the new Sandforce controller isn't out yet. We'll see.Magichands8 - Monday, September 24, 2012 - link
Technically this all looks great. Nice performance and power characteristics across the board. But where is the real distinguishing factor? All these drives are getting capped out thanks to SATA limitations and how much am I going to notice the difference between 500 MB/s and 490 MB/s in real world usage? Prices remain high and capacities remain low. We have reliability, high performance, low power usage and even TRIM over RAID now. SAMSUNG, INTEL, MICRON, OCZ, SANDISK, are you listening?! We need higher CAPACITIES, NOT irrelevant PERFORMANCE gains from intermittent firmware tweaks every six months!I read somewhere that it's going to take another year/year-and-a-half for them to build/expand/retool plants to the point where we can see reasonable capacity increases at reasonable prices but it's very frustrating and disappointing to see basically no improvement upon capacities with extremely sluggish price improvement. It's getting to the point where I'm not even interested in new SSD reviews anymore.
However if capacities ever hit 2TB+ for $250-$300 I have a hard time imagining what could compel me to buy traditional HDDs when my main concerns with such an array would boil down to a mechanical failure somewhere, heat, noise and space (which are all addressed by SSDs). I'm sure that the new tech coming down the pipes for magnetic storage are going to do wonders for capacities but at some point that almost becomes a liability since there will always be a huge performance bottleneck.
seapeople - Monday, September 24, 2012 - link
Considering that I paid ~$2/GB for an Intel SSD just 18 months ago, and now drives that are twice as fast are selling for half as much, I'd say you're being unreasonably impatient.Grok42 - Monday, September 24, 2012 - link
Prices are going down, they are still just very high per GB compared to magnetic drives. If they can get in the range of double the cost of HDDs in the next 2-3 years I think you'll see everything move over to SSD given all the other benefits.I think what you're feeling is that the capacity isn't going up at all. I can't really see being able to buy a 2TB SSD for less than $400 in the next few years. I do see being able to buy a 250GB drive for $80 which is about 2x what an equivalent 500GB regular HDD costs if you bought two SSDs. Seems capacity is very non-linear and nothing has improved.
FunBunny2 - Tuesday, September 25, 2012 - link
The capacity issue could be mitigated a whole bunch if the SSD folks built them on 3.5 form factor. Some truly enterprise SSD vendors till do. The volume difference is substantial. Instead, we get TLC stuff.Death666Angel - Tuesday, September 25, 2012 - link
3.5" drives have the same dice in there as 2.5" drives and the controller PCB layout wouldn't be any cheaper either. If you look at prices of current generation SSDs, the 256GB version usually have the best price/GB. Unless you are saying that NAND packages with more dice are more expensive (which I can't see when I compare drives of different NAND package sizes with one another, often enough those with 4 dice are cheaper than those with 2 dice), then I don't see how going to 3.5" SSDs is going to make capacities cheaper.