The NVIDIA GeForce GTX 660 Review: GK106 Fills Out The Kepler Family
by Ryan Smith on September 13, 2012 9:00 AM ESTCompute Performance
As always our final set of real-world benchmarks is composed of a look at compute performance. As we have seen with GTX 680 and GTX 670, Kepler appears to be significantly less balanced between rendering and compute performance than GF110 or GF114 were, and as a result compute performance suffers. Further compounding this is the fact that GK106 only has 5 SMXes versus the 8 SMXes of GK104, which will likely further depress compute performance.
Our first compute benchmark comes from Civilization V, which uses DirectCompute to decompress textures on the fly. Civ V includes a sub-benchmark that exclusively tests the speed of their texture decompression algorithm by repeatedly decompressing the textures required for one of the game’s leader scenes. Note that this is a DX11 DirectCompute benchmark.
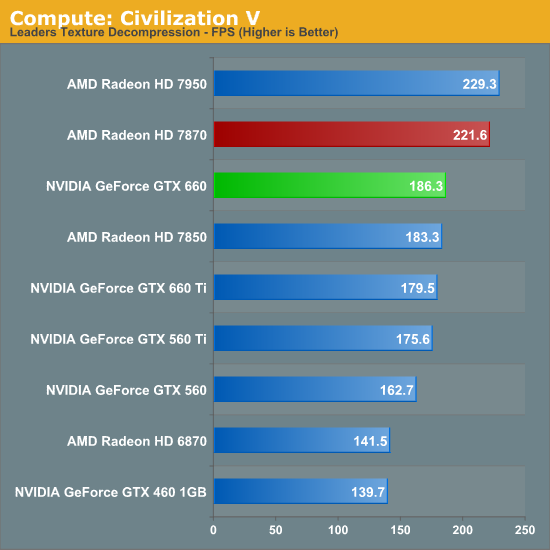
It’s interesting then that despite the obvious difference between the GTX 660 and GTX 660 Ti in theoretical compute performance, the GTX 660 actually beats the GTX 660 Ti here. Despite being a compute benchmark, Civlization V’s texture decompression benchmark is more sensitive to memory bandwidth and cache performance than it is shader performance, giving us the results we see above. Given the GTX 660 Ti’s poor showing in this benchmark this is a good thing for NVIDIA since this means they don’t fall any farther behind. Still, the GTX 660 is effectively tied with the 7850 and well behind the 7870.
Our next benchmark is SmallLuxGPU, the GPU ray tracing branch of the open source LuxRender renderer. We’re now using a development build from the version 2.0 branch, and we’ve moved on to a more complex scene that hopefully will provide a greater challenge to our GPUs.
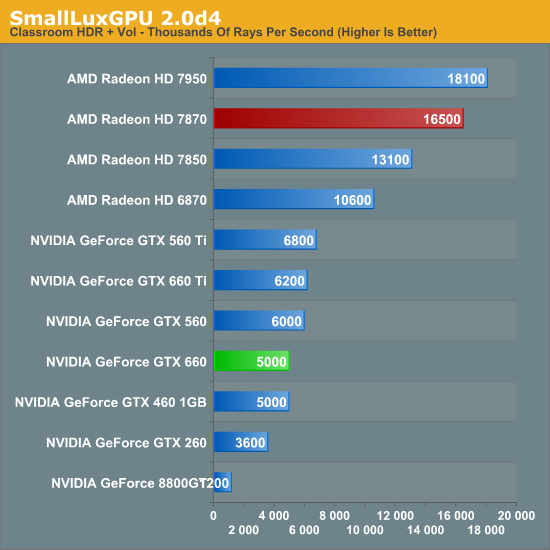
SmallLuxGPU sees us shift towards an emphasis on pure compute performance, which of course is going to be GTX 660’s weak point here. Over 2 years after the launch of the GTX 460 and SLG performance has gone exactly nowhere, with the GTX 460 and GTX 660 turning in the same exact scores. Thank goodness the 8800GT is terrible at this benchmark, otherwise the GTX 660 would be in particularly bad shape.
It goes without saying that with the GTX 660’s poor compute performance here, the 7800 series is well in the lead. The 7870 more than trebles the GTX 660’s performance, an indisputable victory if there ever was one.
For our next benchmark we’re looking at AESEncryptDecrypt, an OpenCL AES encryption routine that AES encrypts/decrypts an 8K x 8K pixel square image file. The results of this benchmark are the average time to encrypt the image over a number of iterations of the AES cypher.
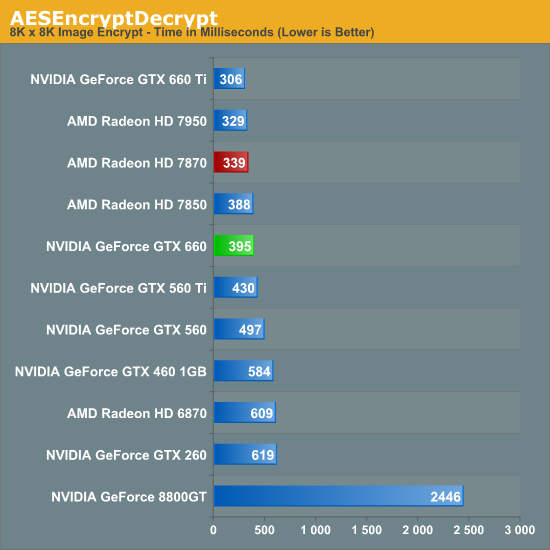
Our AES benchmark was one of the few compute benchmarks where the GTX 660 Ti had any kind of lead, but the significant loss of compute resources has erased that for the GTX 660. At 395ms it’s a hair slower than the 7850, never mind the 7870.
For our next benchmark we’re looking at AESEncryptDecrypt, an OpenCL AES encryption routine that AES encrypts/decrypts an 8K x 8K pixel square image file. The results of this benchmark are the average time to encrypt the image over a number of iterations of the AES cypher.
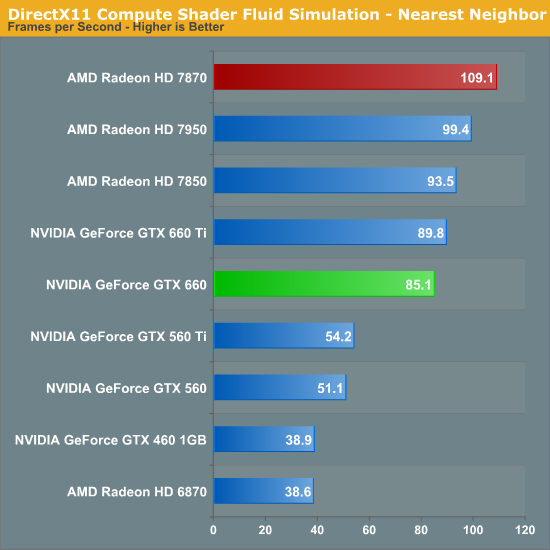
The fluid simulation is another benchmark that includes a stronger mix of memory bandwidth and cache rather than being purely dependent on compute resources. As a result the GTX 660 still trails the GTX 660 Ti, but by a great amount. Even so, the GTX 660 is no match for the 7800 series.
Finally, we’re adding one last benchmark to our compute run. NVIDIA and the Folding@Home group have sent over a benchmarkable version of the client with preliminary optimizations for Kepler. Folding@Home and similar initiatives are still one of the most popular consumer compute workloads, so it’s something NVIDIA wants their GPUs to do well at.
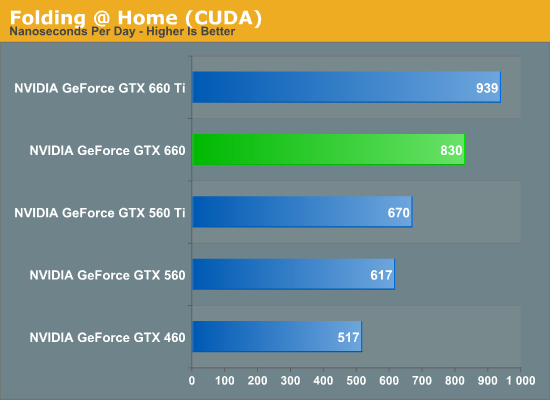
As we’ve seen previously with GK104, this is one of the few compute benchmarks that shows any kind of significant performance advantage for Little Kepler compared to Little Fermi. GTX 660 drops by 12% compared to GTX 660 Ti, but this is still good enough for a 60% performance advantage over GTX 460.


147 Comments
View All Comments
CeriseCogburn - Wednesday, September 19, 2012 - link
Hey Gilligan, stop ragging.Gastec - Thursday, November 15, 2012 - link
Nvidia cards are for rich people. ATI/AMD cards are for poor people. Just like rich people drive Mercedes and poor people drive american cars. Is that enough for you want more? I was poor and I had to buy a ATI card. Now I'm not poor anymore so I'm going to buy a Nvidia card in December. Quod erat demonstrandum. Now fuck off!Model192 - Friday, December 7, 2012 - link
I have a Corvette and I buy AMD. Guess I'm double retarded? Or does the Corvette not quite fit into your theory about being poor and buying AMD/ATI.nerrrd - Wednesday, March 13, 2013 - link
corvettes are american cars...stm1185 - Thursday, September 13, 2012 - link
Techpowerup includes more games where AMD has a slight edge, but does that edge make a difference in those games? I'd argue no because frame rate in a console port adventure game like Alan Wake is not a big deal.Also face it most of those 2012 games are mediocre. Who is spending 60 hours a week playing Sniper Elite or Max Payne? No one, but for SC2, BF3, Skyrim, they do, hell some guys have to by contract!
7870 is not a better card, it's about equal, or worse depending on what you play. For a competitive gamer, the GTX660 is the better card, because it's better for BF3, and it's better for SC2 (Amazingly so, best SC2 card!).
RussianSensation - Thursday, September 13, 2012 - link
Data does not back up your claimsBF3 - factory overclocked 660 trades blows with a factory overclocked 7870
http://www.hardocp.com/article/2012/09/13/asus_gef...
BF3 - barely any difference (but comparing a reference 660 it doesn't win either)
http://www.techpowerup.com/reviews/ASUS/GeForce_GT...
Skyrim - 7870 wins
http://www.hardocp.com/article/2012/09/13/asus_gef...
Skyrim - 7870 wins
http://www.techpowerup.com/reviews/ASUS/GeForce_GT...
Add mods to Skyrim and 7870 wins by 20-40%
http://www.computerbase.de/artikel/grafikkarten/20...
Also, you are discounting performance in 12-15 games and just focusing on the games you think are most important. That's your opinion. Starcraft 2 for example is playable on a GTX560/HD6870 without any problems. Plus in a strategy game you only need 30-45 fps for it to feel smooth and modern cards get 70-100 fps! So really your point about SC2 is hardly relevant.
The reason we look at more games is because not everyone spends 200 hours a month playing BF3 only.
Overall, 660 is not any better (actually a slower card unless you consider factory overclocked versions)
http://www.computerbase.de/artikel/grafikkarten/20...
stm1185 - Thursday, September 13, 2012 - link
So Anandtech is lying then? Those numbers I see right above this post are false?Margalus - Thursday, September 13, 2012 - link
sorry, but you lost all credibility by linking hardocp. That is the worst hardware site on the internet. They gave up all premises of being unbiased and fair years ago.ninjaquick - Thursday, September 13, 2012 - link
? They compare OC parts with OC parts, rather than average out the OC parts results and place them against stock parts.Different systems have different results, Anandtech didn't lie, AFAICT. nobody has fudged results (esp. not w1zzard)
formulav8 - Thursday, September 13, 2012 - link
No cred lost. Your opinion only. Hardocp simply uses different methods of comparison. Some like it, some don't.