The Intel Ivy Bridge (Core i7 3770K) Review
by Anand Lal Shimpi & Ryan Smith on April 23, 2012 12:03 PM EST- Posted in
- CPUs
- Intel
- Ivy Bridge
The Test
It turns out that our initial preview numbers were quite good. The shipping 3770K performs identically to what we tested last month. To keep the review length manageable we're presenting a subset of our results here. For all benchmark results and even more comparisons be sure to use our performance comparison tool: Bench.
| Motherboard: | ASUS P8Z68-V Pro (Intel Z68) ASUS Crosshair V Formula (AMD 990FX) Intel DX79SI (Intel X79) Intel DZ77GA-70K (Intel Z77) |
| Hard Disk: | Intel X25-M SSD (80GB) Crucial RealSSD C300 OCZ Agility 3 (240GB) |
| Memory: | 4 x 4GB G.Skill Ripjaws X DDR3-1600 9-9-9-20 |
| Video Card: | ATI Radeon HD 5870 (Windows 7) AMD Processor Graphics Intel Processor Graphics |
| Video Drivers: | AMD Catalyst 12.3 |
| Desktop Resolution: | 1920 x 1200 |
| OS: | Windows 7 x64 |
General Performance
SYSMark 2007 & 2012
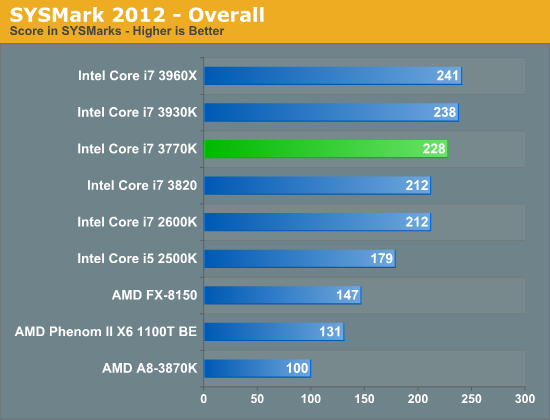
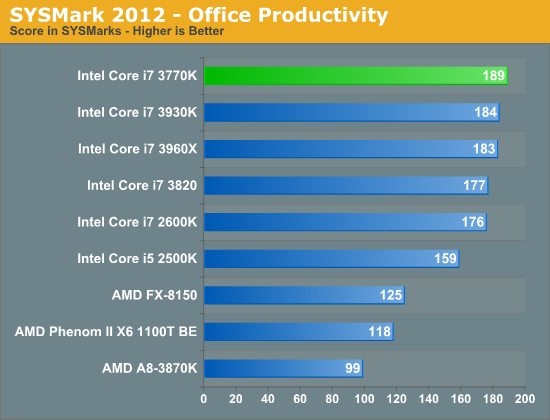
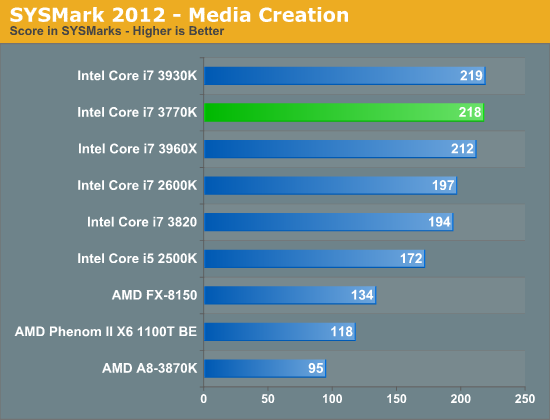
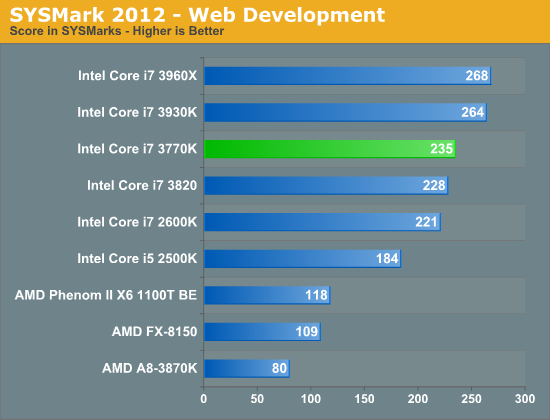
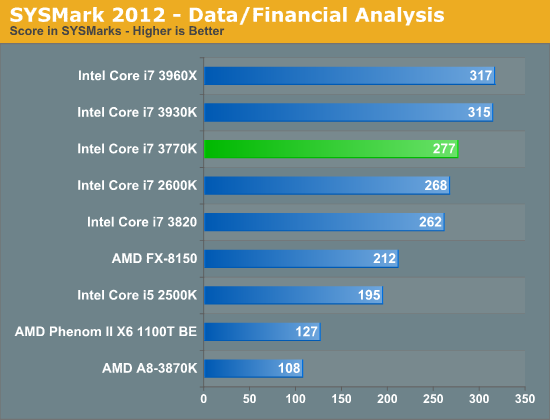
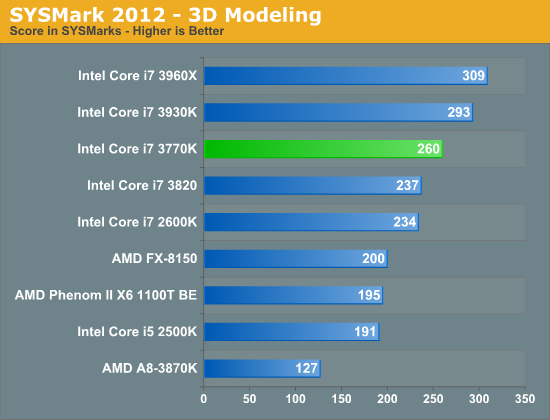
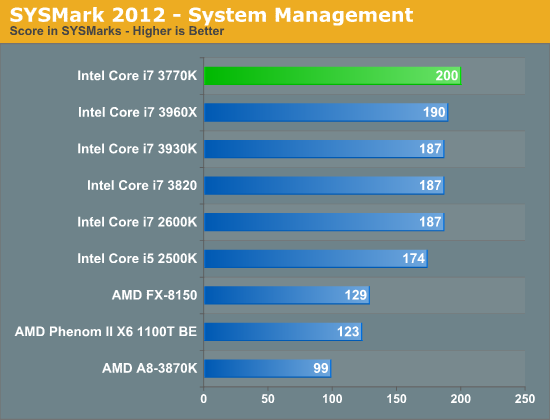
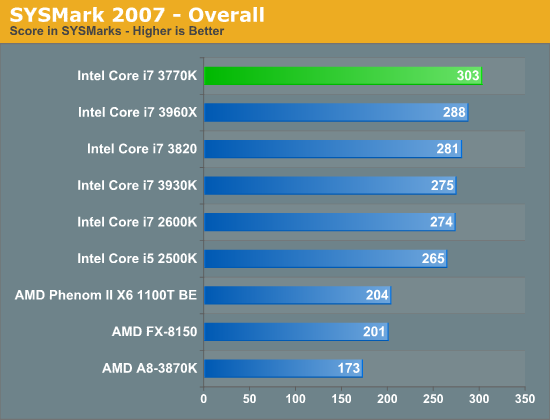
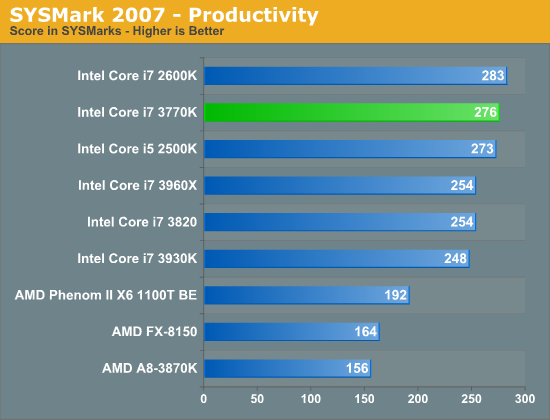
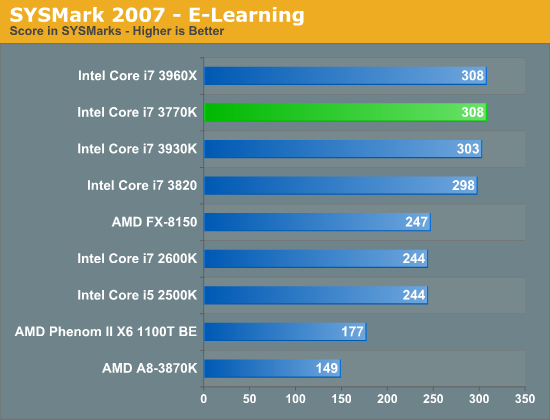
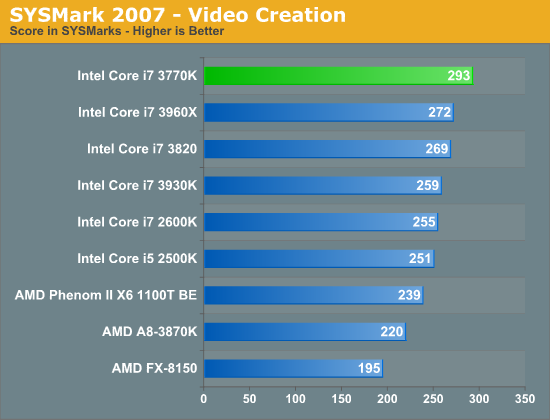
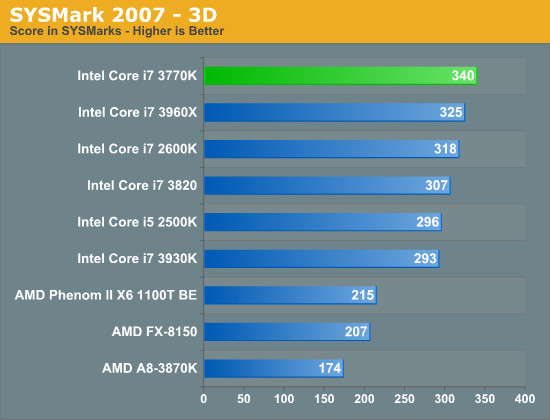
Although not the best indication of overall system performance, the SYSMark suites do give us a good idea of lighter workloads than we're used to testing. SYSMark 2007 is a better indication of low thread count performance, although 2012 isn't tremendously better in that regard.
As the SYSMark suites aren't particularly thread heavy, there's little advantage to the 6-core Sandy Bridge E CPUs. The 3770K however manages to slot in above all of the other Sandy Bridge parts at between 5—20% faster than the 2600K. The biggest advantages show up in either the lightly threaded tests or in the FP heavy benchmarks. Given what we know about Ivy's enhancements, this is exactly what we'd expect.
Content Creation Performance
Adobe Photoshop CS4
To measure performance under Photoshop CS4 we turn to the Retouch Artists’ Speed Test. The test does basic photo editing; there are a couple of color space conversions, many layer creations, color curve adjustment, image and canvas size adjustment, unsharp mask, and finally a gaussian blur performed on the entire image.
The whole process is timed and thanks to the use of Intel's X25-M SSD as our test bed hard drive, performance is far more predictable than back when we used to test on mechanical disks.
Time is reported in seconds and the lower numbers mean better performance. The test is multithreaded and can hit all four cores in a quad-core machine.
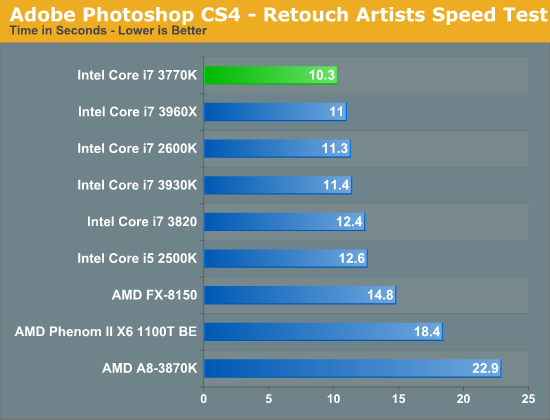
Our Photoshop test is well threaded but it doesn't peg all cores constantly. Instead you get burstier behavior. With the core count advantage out of the way, SNB-E steps aside and allows the 3770K to step up as the fastest CPU we've tested here. The performance advantage over the 2600K is around 9%.
3dsmax 9
Today's desktop processors are more than fast enough to do professional level 3D rendering at home. To look at performance under 3dsmax we ran the SPECapc 3dsmax 8 benchmark (only the CPU rendering tests) under 3dsmax 9 SP1. The results reported are the rendering composite scores.
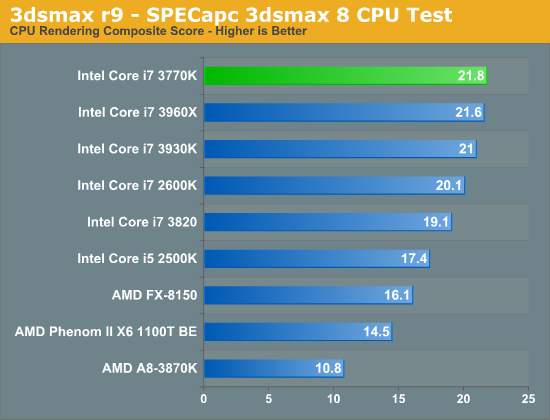
In another FP heavy workload we see a pretty reasonable gain for Ivy Bridge: 8.5% over a 2600K. This isn't enough to make you want to abandon your Sandy Bridge, but it's a good step forward for a tick.
Cinebench 11.5
Created by the Cinema 4D folks we have Cinebench, a popular 3D rendering benchmark that gives us both single and multi-threaded 3D rendering results.
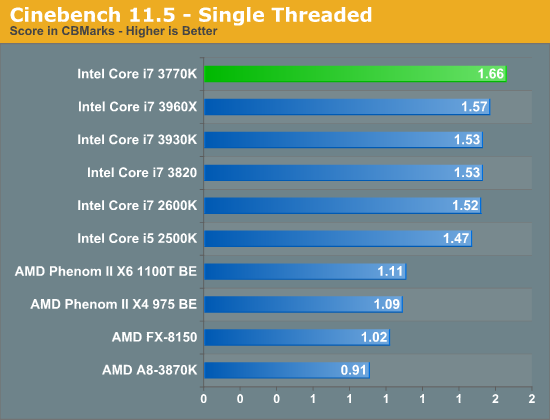
The single threaded Cinebench test shows a 9% performance advantage for the 3770K over the 2600K. The gap increases slightly to 11% as we look at the multithreaded results:
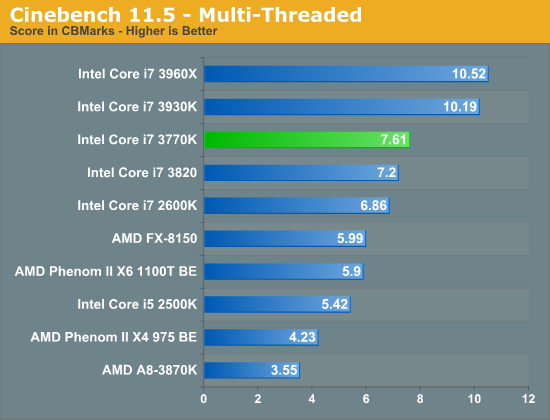
If you're running a workload that can really stress multiple cores, the 6-core Sandy Bridge E parts will remain unstoppable but in the quad-core world, Ivy Bridge leads the pack.
Video Transcoding Performance
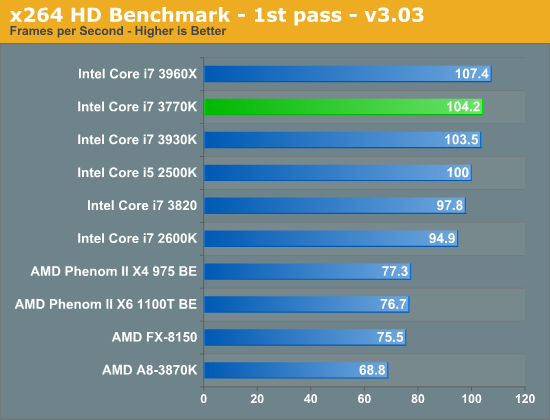
x264 HD 3.03 Benchmark
Graysky's x264 HD test uses x264 to encode a 4Mbps 720p MPEG-2 source. The focus here is on quality rather than speed, thus the benchmark uses a 2-pass encode and reports the average frame rate in each pass.
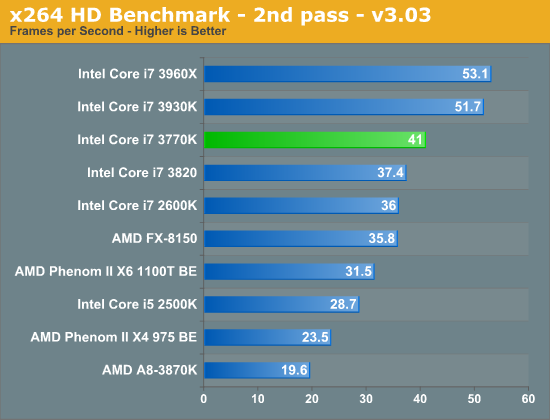
In the second pass of our x264 test we see a nearly 14% increase over the 2600K. Once again, there's no replacement for more cores in these types of workloads but delivering better performance in a lower TDP than last year's quad-core is great for more thermally conscious desktops.
Software Development Performance
Compile Chromium Test
You guys asked for it and finally I have something I feel is a good software build test. Using Visual Studio 2008 I'm compiling Chromium. It's a pretty huge project that takes over forty minutes to compile from the command line on a Core i3 2100. But the results are repeatable and the compile process will stress all 12 threads at 100% for almost the entire time on a 980X so it works for me.
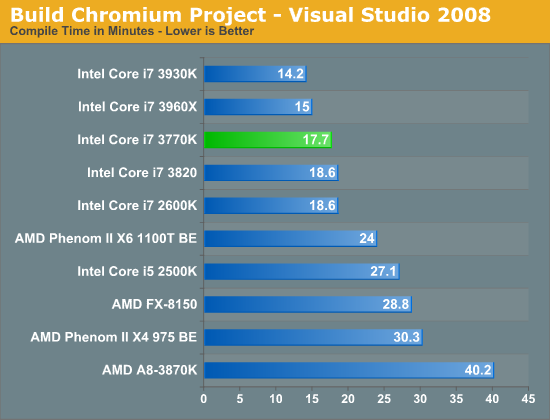
Ivy Bridge shows more traditional gains in our VS2008 benchmark—performance moves forward here by a few percent, but nothing significant. We are seeing a bit of a compressed dynamic range here for this particular compiler workload, it's quite possible that other bottlenecks are beginning to creep in as we get even faster microarchitectures.
Compression & Encryption Performance
7-Zip Benchmark
By working with a small dataset, the 7-zip benchmark gives us an indication of multithreaded integer performance without being IO limited:
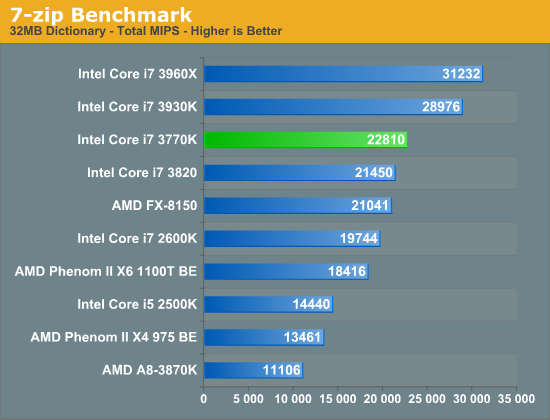
Although real world compression/decompression tests can be heavily influenced by disk IO, the CPU does play a significant role. Here we're showing a 15% increase in performance over the 2600K. In the real world you'd see something much smaller as workloads aren't always so well threaded. The results here do have implications for other heavily compute bound integer workloads however.
TrueCrypt Benchmark
TrueCrypt is a very popular encryption package that offers full AES-NI support. The application also features a built-in encryption benchmark that we can use to measure CPU performance:
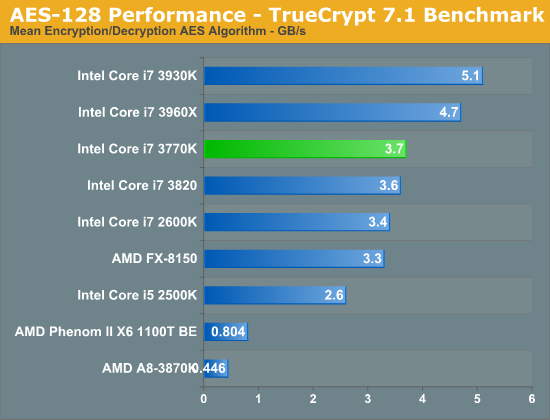
Our TrueCrypt test scales fairly well with clock speed, I suspect what we're seeing here might be due in part to Ivy's ability to maintain higher multi-core turbo frequencies despite having similar max turbo frequencies to Sandy Bridge.


173 Comments
View All Comments
dagamer34 - Monday, April 23, 2012 - link
I see them just killing off the 13" MacBook Pro entirely, and upgrading the SSD base size to 256GB. There's little reason for the Pro to live on anymore when the Air is far superior in everything except for CPU.gorash - Monday, April 23, 2012 - link
Really... the Air's screen is terrible. Plus Air is basically not user upgradeable.Breach1337 - Monday, April 23, 2012 - link
Yeah, I view mine as a consumable. And I love it.tipoo - Monday, April 23, 2012 - link
That would be a shame, even without the optical drive they could differentiate the 13" pro from the Air with the mentioned 35w quad core CPU, or a discreet GPU in all the space they saved from ditching the ODD, and have more space for battery to offset it.jaydee - Monday, April 23, 2012 - link
If I'm buying a system for onboard GPU gaming, I'm going AMD. If I'm buying a system for cpu performance with overclocking, I'm buying Sandy Bridge. I'm not sure what the point of this launch is.A5 - Monday, April 23, 2012 - link
Notebooks/ultrabooks and debugging the new process node.8steve8 - Monday, April 23, 2012 - link
I've seen so many negative comments like this about Ivy Bridge all over the web... so I'll respond to them all here:I'd rather have higher energy efficiency and stability (and less noise), which comes with running at stock voltage/clock speeds. I am not alone there... Plus with turbo boost, why bother OCing, when it has the thermal headroom, it boosts the clock...
If you think that you can find a significantly better sweat spot of performance, power consumption, and reliability/lifespan of the average high-end (K) CPU from intel, then I have to call BS on that. If you agree that intel knows their cpus better than you, but are purposely under-clocking them (the highest clocked models), then I would ask why.
I may say that given significantly more exotic/larger/louder coolers, maybe you can dissipate more heat than the processors were designed to dissipate, and you have some headroom to raise the voltage, which may yield higher stable frequencies, but keep in mind power is roughly proportional to voltage^2, so energy efficiency goes out the window real fast...
I'm not saying no one should play around with their CPUs, have fun... but to say ivy bridge is pointless just because you can't over-volt/over-clock it to the same extent as sandy bridge is foolish when it's clearly a significant step forward, and the best solution for the vast majority x86 PCs.
For those of us who want an energy efficient, high performance computer, some variant of ivy bridge will be the best option, probably until haswell/2013.
Thanks intel, and thanks Anand for the review.
jaydee - Monday, April 23, 2012 - link
But it's really not that much more efficient. In fact at idle, the difference is negligible by all benchmarks I've seen, which for most users is the most important area. At full power, a difference of 25 watts is practically nothing given how much time most cpu's are spent at that load. It really shouldn't affect power supply sizing either. I'm just talking about desktop usage here, we don't really have a good look at the notebook chips yet.I'm not sure what Intel thinks it's pulling by calling this "tick+" instead of a regular "tick". I don't see anything here that's really that appealing. If helps Intel "debug the process node for 22nm", that's great for Intel, but it doesn't sway me as a consumer to buy one.
JarredWalton - Monday, April 23, 2012 - link
Idle power quickly hits a limit based on everything else in the system. It's hardly surprising that the highly efficient Sandy Bridge does just as well at idle as Ivy Bridge. Power gating allows Intel to basically shut down everything that's not being used, and the result is that low loads have pretty much hit their limits. What's impressive is the big drop in power use under heavier loads.As for the "tick+", it's all in the GPU. They went from DX10 12EU in SNB to DX11 and 16EU in IVB. As a percentage of total die size, the GPU in IVB is much larger than the one in SNB. But as Anand notes, we still would have liked more (e.g. a 24 EU GT3 would have been awesome for IGP performance).
owan - Monday, April 23, 2012 - link
Marginal improvement over Sandy Bridge that can be compensated for by SB's significantly better overclocking ability. Why so much praise for the IGP when 95% of desktop users don't care AND its still vastly inferior to Llano? With so much focus on mobile I'm not even sure why they bothered releasing a high-end desktop SKU