The Intel Ivy Bridge (Core i7 3770K) Review
by Anand Lal Shimpi & Ryan Smith on April 23, 2012 12:03 PM EST- Posted in
- CPUs
- Intel
- Ivy Bridge
The Test
It turns out that our initial preview numbers were quite good. The shipping 3770K performs identically to what we tested last month. To keep the review length manageable we're presenting a subset of our results here. For all benchmark results and even more comparisons be sure to use our performance comparison tool: Bench.
| Motherboard: | ASUS P8Z68-V Pro (Intel Z68) ASUS Crosshair V Formula (AMD 990FX) Intel DX79SI (Intel X79) Intel DZ77GA-70K (Intel Z77) |
| Hard Disk: | Intel X25-M SSD (80GB) Crucial RealSSD C300 OCZ Agility 3 (240GB) |
| Memory: | 4 x 4GB G.Skill Ripjaws X DDR3-1600 9-9-9-20 |
| Video Card: | ATI Radeon HD 5870 (Windows 7) AMD Processor Graphics Intel Processor Graphics |
| Video Drivers: | AMD Catalyst 12.3 |
| Desktop Resolution: | 1920 x 1200 |
| OS: | Windows 7 x64 |
General Performance
SYSMark 2007 & 2012
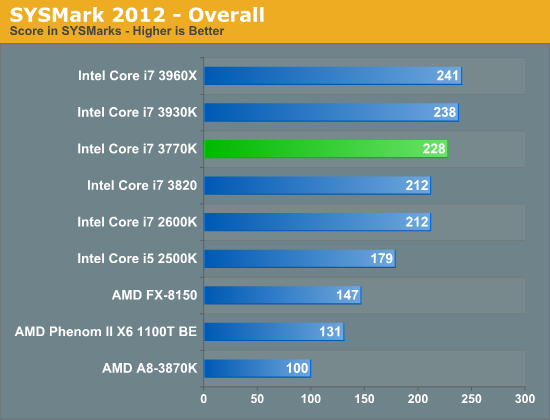
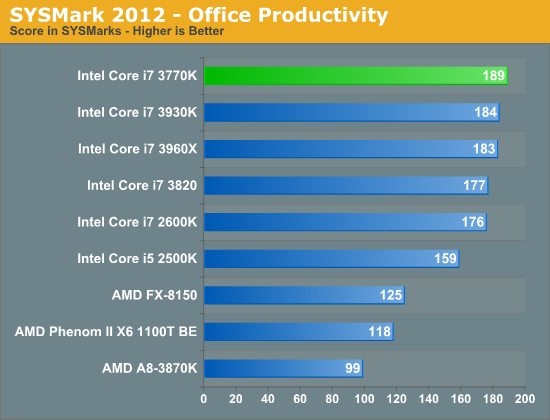
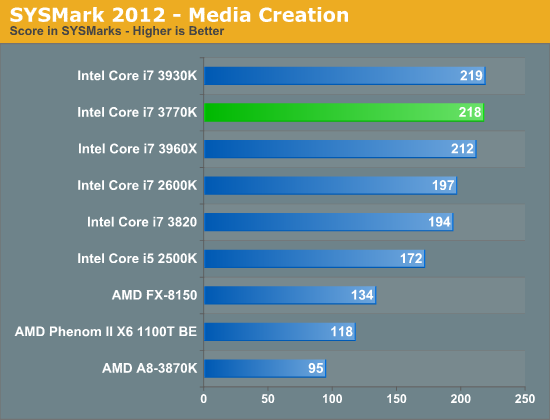
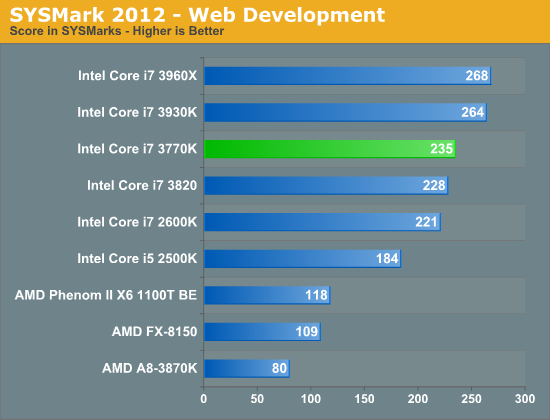
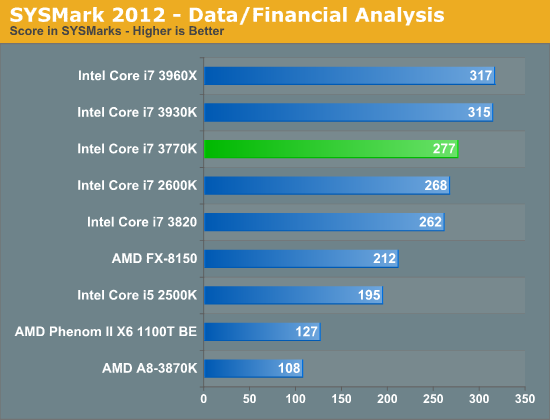
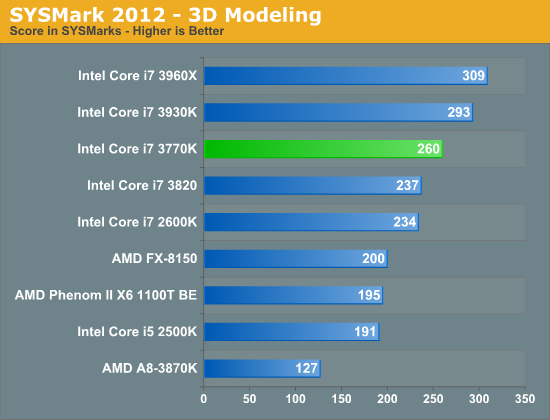
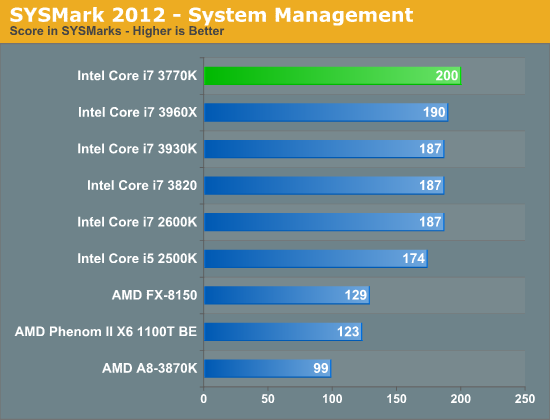
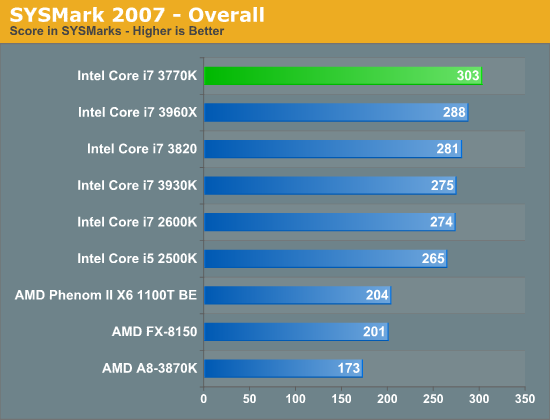
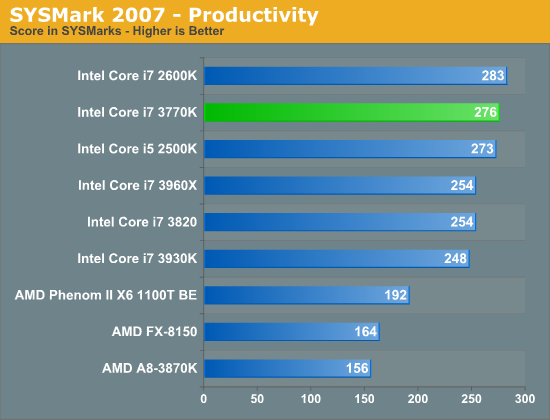
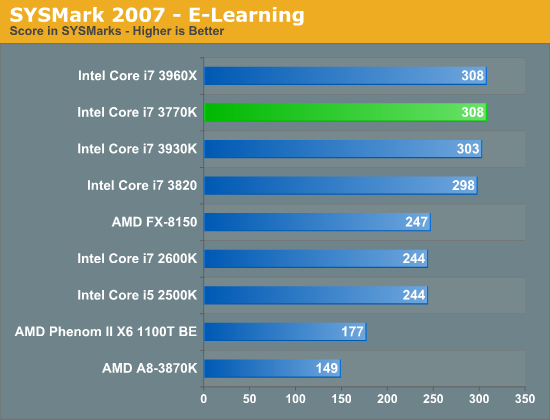
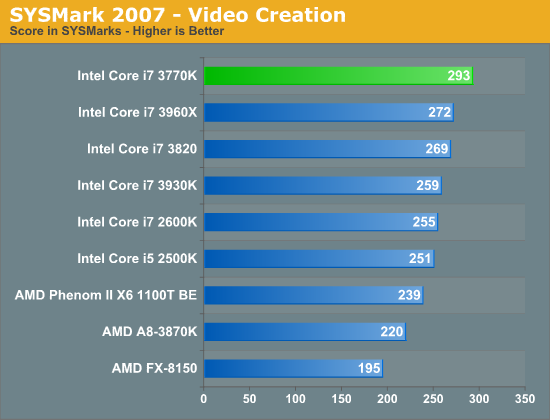
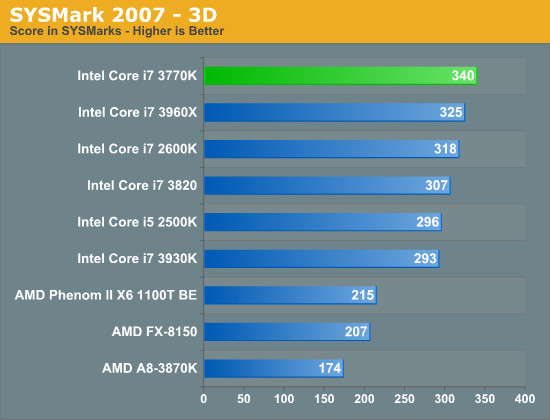
Although not the best indication of overall system performance, the SYSMark suites do give us a good idea of lighter workloads than we're used to testing. SYSMark 2007 is a better indication of low thread count performance, although 2012 isn't tremendously better in that regard.
As the SYSMark suites aren't particularly thread heavy, there's little advantage to the 6-core Sandy Bridge E CPUs. The 3770K however manages to slot in above all of the other Sandy Bridge parts at between 5—20% faster than the 2600K. The biggest advantages show up in either the lightly threaded tests or in the FP heavy benchmarks. Given what we know about Ivy's enhancements, this is exactly what we'd expect.
Content Creation Performance
Adobe Photoshop CS4
To measure performance under Photoshop CS4 we turn to the Retouch Artists’ Speed Test. The test does basic photo editing; there are a couple of color space conversions, many layer creations, color curve adjustment, image and canvas size adjustment, unsharp mask, and finally a gaussian blur performed on the entire image.
The whole process is timed and thanks to the use of Intel's X25-M SSD as our test bed hard drive, performance is far more predictable than back when we used to test on mechanical disks.
Time is reported in seconds and the lower numbers mean better performance. The test is multithreaded and can hit all four cores in a quad-core machine.
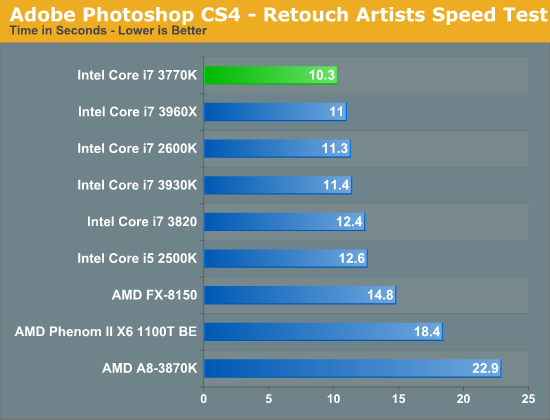
Our Photoshop test is well threaded but it doesn't peg all cores constantly. Instead you get burstier behavior. With the core count advantage out of the way, SNB-E steps aside and allows the 3770K to step up as the fastest CPU we've tested here. The performance advantage over the 2600K is around 9%.
3dsmax 9
Today's desktop processors are more than fast enough to do professional level 3D rendering at home. To look at performance under 3dsmax we ran the SPECapc 3dsmax 8 benchmark (only the CPU rendering tests) under 3dsmax 9 SP1. The results reported are the rendering composite scores.
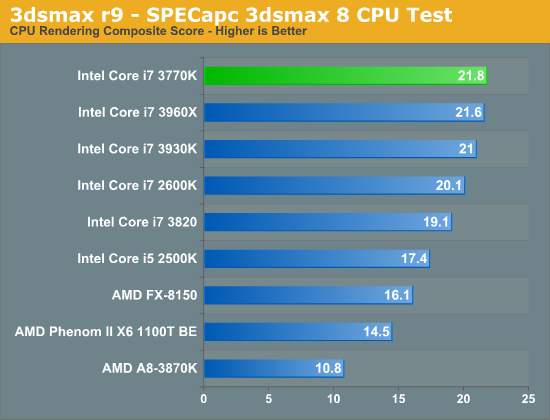
In another FP heavy workload we see a pretty reasonable gain for Ivy Bridge: 8.5% over a 2600K. This isn't enough to make you want to abandon your Sandy Bridge, but it's a good step forward for a tick.
Cinebench 11.5
Created by the Cinema 4D folks we have Cinebench, a popular 3D rendering benchmark that gives us both single and multi-threaded 3D rendering results.
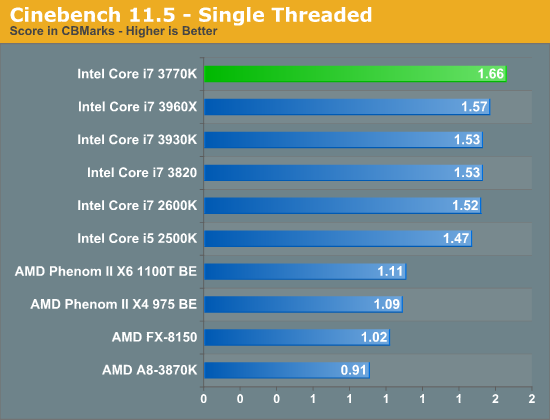
The single threaded Cinebench test shows a 9% performance advantage for the 3770K over the 2600K. The gap increases slightly to 11% as we look at the multithreaded results:
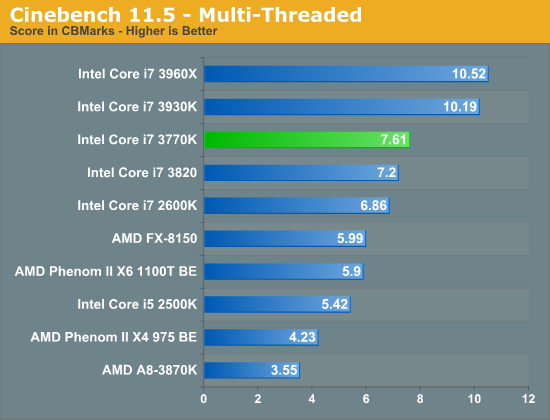
If you're running a workload that can really stress multiple cores, the 6-core Sandy Bridge E parts will remain unstoppable but in the quad-core world, Ivy Bridge leads the pack.
Video Transcoding Performance
x264 HD 3.03 Benchmark
Graysky's x264 HD test uses x264 to encode a 4Mbps 720p MPEG-2 source. The focus here is on quality rather than speed, thus the benchmark uses a 2-pass encode and reports the average frame rate in each pass.
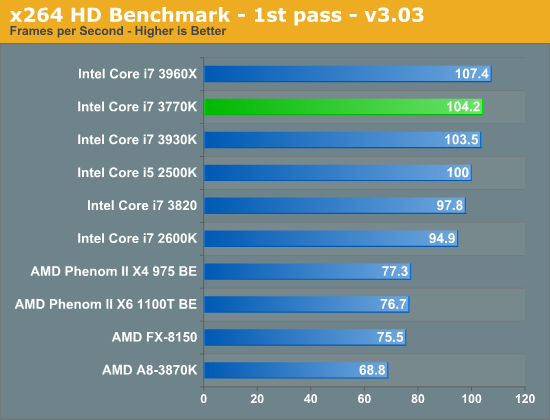
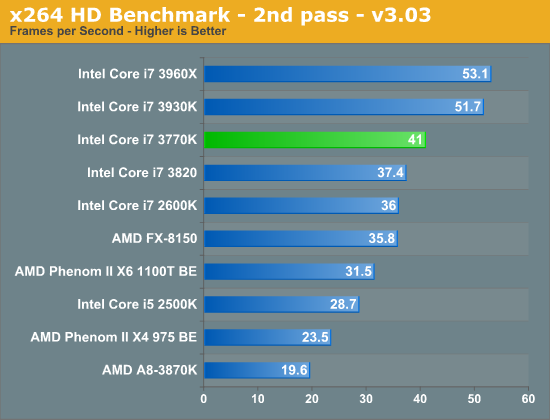
In the second pass of our x264 test we see a nearly 14% increase over the 2600K. Once again, there's no replacement for more cores in these types of workloads but delivering better performance in a lower TDP than last year's quad-core is great for more thermally conscious desktops.
Software Development Performance
Compile Chromium Test
You guys asked for it and finally I have something I feel is a good software build test. Using Visual Studio 2008 I'm compiling Chromium. It's a pretty huge project that takes over forty minutes to compile from the command line on a Core i3 2100. But the results are repeatable and the compile process will stress all 12 threads at 100% for almost the entire time on a 980X so it works for me.
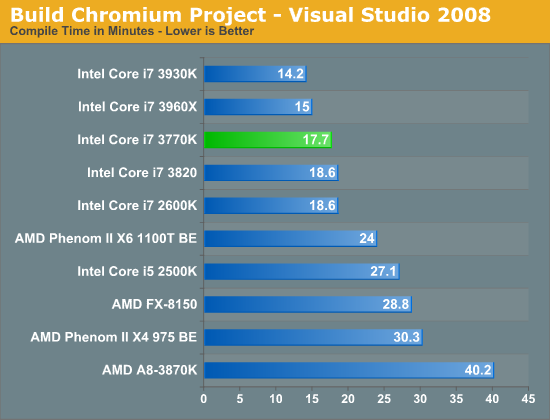
Ivy Bridge shows more traditional gains in our VS2008 benchmark—performance moves forward here by a few percent, but nothing significant. We are seeing a bit of a compressed dynamic range here for this particular compiler workload, it's quite possible that other bottlenecks are beginning to creep in as we get even faster microarchitectures.
Compression & Encryption Performance
7-Zip Benchmark
By working with a small dataset, the 7-zip benchmark gives us an indication of multithreaded integer performance without being IO limited:
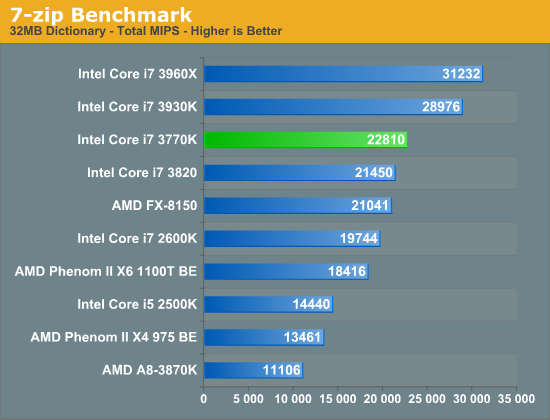
Although real world compression/decompression tests can be heavily influenced by disk IO, the CPU does play a significant role. Here we're showing a 15% increase in performance over the 2600K. In the real world you'd see something much smaller as workloads aren't always so well threaded. The results here do have implications for other heavily compute bound integer workloads however.
TrueCrypt Benchmark
TrueCrypt is a very popular encryption package that offers full AES-NI support. The application also features a built-in encryption benchmark that we can use to measure CPU performance:
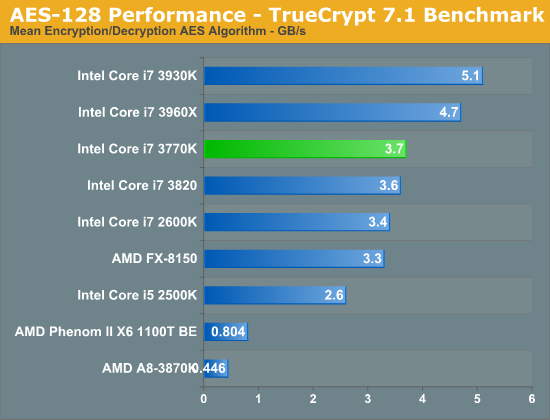
Our TrueCrypt test scales fairly well with clock speed, I suspect what we're seeing here might be due in part to Ivy's ability to maintain higher multi-core turbo frequencies despite having similar max turbo frequencies to Sandy Bridge.


173 Comments
View All Comments
sld - Wednesday, April 25, 2012 - link
.... and in this multivariate comparison you choose to ignore the superior battery life which makes Llano a serious competitor in the mobile space.midn8t - Thursday, June 28, 2012 - link
this the frames pre secound for CPU, you cant really figure out well when gamming its all mostly based around what ever video card they used, in this artical so I would have to guess that they might have used diffrent GPU video card in each system.obivuously they cant use same motherboard for amd vs intel
Also I find it wired that other reciews have Rated the phenom II x6 lower in preformance then the FX chip makes it wired how these review claims that the phenom II which is lower grade CPU is more powerfull then the top of the line AMD product out.
zeagus - Wednesday, April 25, 2012 - link
A huge chunk of text is spent explaining how while its a step in the right direction, they need to do more on the GPU side of the equation. Take off your strangely coloured glasses.wingless - Monday, April 23, 2012 - link
EDIT: I'M NOT KIDDING. I bought my 2600K the Friday before last for $199 and paired it with an ASUS P8Z77-V PRO. Ivy Bridge is simply too hot and lacks OC performance.I overclock so I WILL be keeping my 2600K for the foreseeable future!
fredisdead - Sunday, April 29, 2012 - link
So HD4000 igp is weaker than last gen Brazos ?? Based on the leaked Trinity benchmarks, Trinity blows any Intel igp into the weeds, never mind the ( already 1.5 yr old ) Brazos, which is 'only' 5% faster.fredisdead - Sunday, April 29, 2012 - link
So HD4000 igp is weaker than last gen Brazos ?? Based on the leaked Trinity benchmarks, Trinity blows any Intel igp into the weeds, never mind the ( already 1.5 yr old ) Brazos, which is 'only' 5% faster.1ceTr0n - Monday, April 23, 2012 - link
I'll keep my 2500k @ 4.6ghzNot kidding
smookyolo - Monday, April 23, 2012 - link
And I'll keep mine at 4.9GHz.But that's just because I'll be waiting for the tock, not the tick.
I will however be getting a Ivy Bridge Laptop soon.
Flunk - Monday, April 23, 2012 - link
Me too, the 2500K is a great chip. Especially with watercooling.Ratman6161 - Monday, April 23, 2012 - link
For anyone like me who already has a Sandy Bridge quad core (mine's a 2600K) it wouldn't make a lot of sense to "upgrade" to an Ivy bridge. But for those with older systems looking to upgrade, these actually seem like pretty good deals. @ $313 the 3770K is cheaper than the 2700K and cheaper than the typical price on a 2600K (unless like me you are lucky enough to live near a Micro Center).As to those complaining about graphics, come on. Will anyone who really cares a lot about graphics, particularly gaming, be using the on board graphics anyway?