NVIDIA GeForce GTX 680 Review: Retaking The Performance Crown
by Ryan Smith on March 22, 2012 9:00 AM ESTTheoreticals
As with any new architecture, we want to take a few moments to look at theoretical performance. These numbers shouldn’t be taken too seriously for cross-vendor comparison, but these numbers often tell us more about interesting architectural improvements that occur from one generation to the next.

Our first theoretical test is perhaps the most perplexing: 3DMark Vantage’s pixel fill test. Typically this test is memory bandwidth bound as the nature of the test has the ROPs pushing as many pixels as possible with as little overhead as possible, which in turn shifts the bottleneck to a mix of ROP performance and the memory bandwidth needed to feed those ROPs.
Compared to the GTX 580, the GTX 680 has almost exactly the same amount of memory bandwidth (192GB/sec) and only 86% of the theoretical ROP performance (37Gpix vs. 32Gpix). In short, it shouldn’t outperform the GTX 580 here, and yet it outperforms the 580 by 33%.
Why does it do this? That’s the hard thing to answer. As we mentioned in our look at GK104’s architecture, NVIDIA did make some minor incremental improvements to their ROPs coming from GF114, such as slightly improved compression and improved polygon merging. One of those may very well be the contributing factor, particularly the compression improvements since this is a typically memory bandwidth bottlenecked test. Alternatively, it’s interesting to note that the difference between the two video cards is almost identical to the difference in the core clock. GTX 560 Ti’s results tend to blow a hole in this theory, but it bears consideration.
In any case, it’s an interesting turn of events and hopefully one that isn’t simply an edge case. As we’ve seen in our benchmarks GTX 680 has strong performance – even if its lead compared to the 7970 diminishes with resolution – but compared to the GTX 580 in particular it needs strong ROP performance across all games in order to deliver good performance at high resolutions and anti-aliasing.
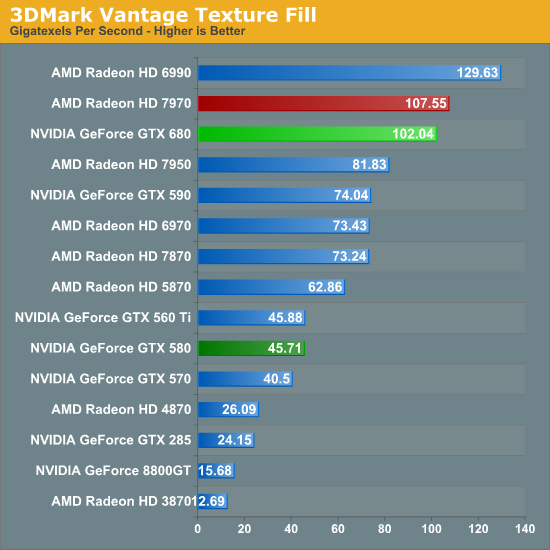
Our second theoretical test is 3DMark Vantage’s texture fill test, which to no surprise has the GTX 680 handily clobbering all prior NVIDIA cards. NVIDIA’s inclusion of 128 texture units on GK104 versus 64 on their previous generation GPUs gives the GTX 680 far better texturing performance. The 30%+ core clock difference only serves to further widen the gap.
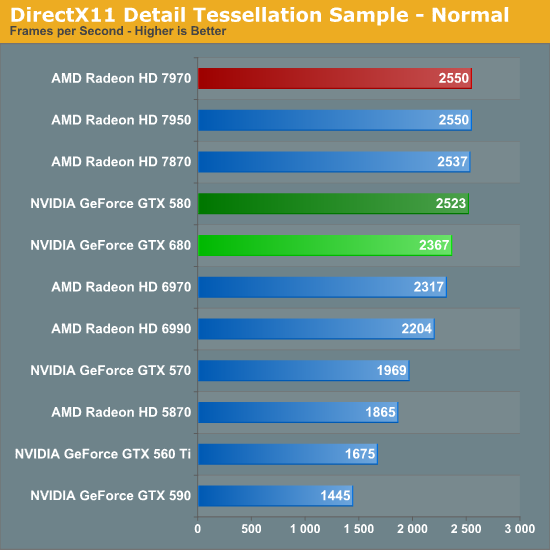
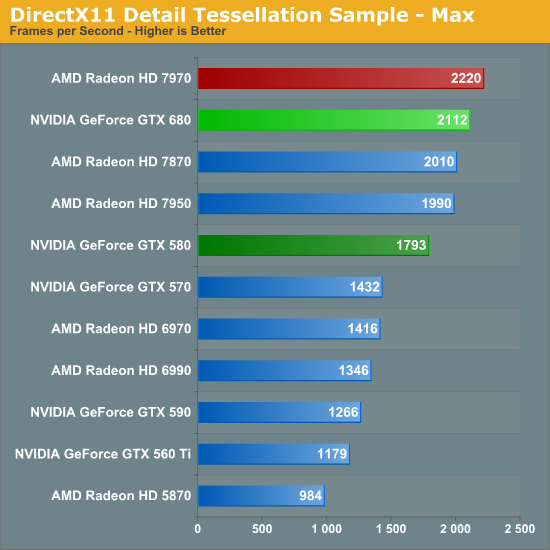
Our third theoretical test is the set of settings we use with Microsoft’s Detail Tessellation sample program out of the DX11 SDK. Overall while NVIDIA didn’t make any significant changes to their tessellation hardware (peak triangle rate is still 4/cycle), they have been working on further improving performance at absurdly high tessellation factors. You can see some of this in action at the max factor setting, but even then we’re running into a general performance wall since the Detail Tessellation program can’t go to the absolute highest tessellation factors NVIDIA’s hardware supports.
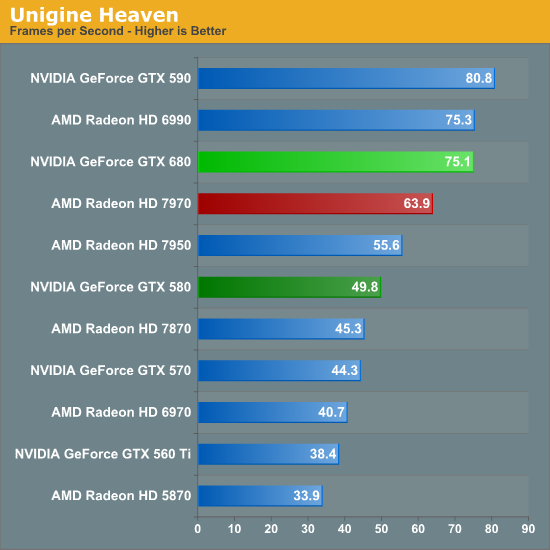
Our final theoretical test is Unigine Heaven 2.5, a benchmark that straddles the line between a synthetic benchmark and a real-world benchmark as the engine is licensed but no notable DX11 games have been produced using it yet. In any case the Heaven benchmark is notable for its heavy use of tessellation, which means it’s largely a proxy test for tessellation performance. Here we can see the GTX 680 shoot well ahead of the GTX 580 – by more than we saw in the DX11 Detail Tessellation sample – but at the same time there’s a lot more going on in Heaven than just tessellation.
Honestly at this point in time I’m not sure just how much more tessellation performance is going to matter. Until DX11 is the baseline API for games, tessellation is still an add-on feature, which means it’s being used to add fine detail to specific models rather than being used on everything in a game world. This demands good tessellation at high factors but at the same time it’s subject to diminishing returns on the improvement to image quality as triangles reach single pixel sizes and smaller. To that end I’m still waiting to see the day where we see tessellation scale similarly to textures – that is by using full MIP chaining of displacement maps – at which point we can evaluate tessellation performance similar to texture performance when it comes to both measuring the performance hit and evaluating the difference in image quality.


404 Comments
View All Comments
SlyNine - Friday, March 23, 2012 - link
lol, you're way of the mark.My point wasn't that the 680GTX isn't faster, it's however that it does stand up well against the 680GTX in performance.
As far as compute goes, I'm not sure I understand your premise. Frankly I think it's an invalid inference. I said kills it. If that somehow implies it means it losses in the other compute tests, I'm not sure how you got there. Again invalid inference of the data.
Galidou - Friday, March 23, 2012 - link
You didn't get the point of what he meant. Yes AMD is loosing but mostly in games that already run 60+fps. The games AMD wins is where it's still not maxed out yet(below 60 fps).Which maybe means if some big demanding games come out, the winning/loosing shceme might go back and forth. But right now, not much games out there will push those gpus unless you got very high resolutions and right now, I think 90% of gamers have 1080p and lower which still runs super smooth with 95% of graphical options enables on a 150$ GPU...
Still gotta say that this GTX 680 is really good for a flagship and the first one that's not uber huge and noisy and hot...
CeriseCogburn - Tuesday, March 27, 2012 - link
Shogun 2 TOTAL WAR, in this bench set is THE HARDEST GAME, not metro2033 and not crysis warhead.Sorry feller but ignoring that gets you guys the big fib you want.
Sorry.
CeriseCogburn - Tuesday, March 27, 2012 - link
SHOGUN 2 680 wins in top rez.from article " Total War: Shogun 2 is the latest installment of the long-running Total War series of turn based strategy games, and alongside Civilization V is notable for just how many units it can put on a screen at once. As it also turns out, it’s the single most punishing game in our benchmark suite"
OH WELL guess it's the metro2033 and crysis game engines cause the hardest game Nvidia 680 wins.
CeriseCogburn - Tuesday, March 27, 2012 - link
No you're WRONG. 1. 608 wins 1 bench in Merto2033, and ties within bench error on the other two resolutions.The hardest game as stated by the reviewer (since you never read) is Shogun2 total war, and Nvidia makes a clean sweep at all resolutions there.
In fact the Nvidia card wins everything but Crysis here, ties on Metro, and smokes everything else.
If Metro isn't a tie, take a look at the tie Ryan has for Civ5 and get back to me... !
(hint: Nvidia wins by far more in Civ5)
So--- let's see, one game with wierd benching old benching and AMD favored benchmark (dumping the waterfall bench that Nvidia won on all the time) >(Crysis)
One "tie" metro2033, then Nvidsia sweeps the rest of them. many by gigantic frame rate victories.
Other places show Nvidia winning metro2003 by a lot. (pureoverclock for one)
....
No I'm not the one fudging, spinning and worse. You guys are. You lost, lost bad, man up.
b3nzint - Monday, March 26, 2012 - link
gt680 got more clocks, way higher memory bandwidth than 7970 thats why it got lower power load and price. but i think we can only compare 2 things if they have the "same" engine like drag race cars. both of them made a big leap from previous tech. and thats a win for us.btw, who comes out first ..amd. i say amd win period. so next time maybe they must release next gen gpu on the same time.
b3nzint - Monday, March 26, 2012 - link
sorry what i meant was gtx 680 has lower memory, so it gain lower power.CeriseCogburn - Tuesday, March 27, 2012 - link
Or so a memory overclock unleashes it and it screams even further away at the tops of the charts...dlitem - Thursday, March 22, 2012 - link
Actual street prices can be different:At least here on the eastern shores of Atlantic ocean German retailers are selling 7970's starting 460-470 eur including taxes with cards on stock and GTX680's are starting 499eur with taxes...
TheRealArdrid - Thursday, March 22, 2012 - link
Sigh, are people really relying on that weak argument again? It's the same thing people said when Intel starting trouncing AMD: it's not fair because Intel has Turbo Boost.