The new iPad: Retina Display Analysis
by Anand Lal Shimpi on March 19, 2012 5:49 PM ESTGoing Into the Pixel: Retina Display Under a Microscope
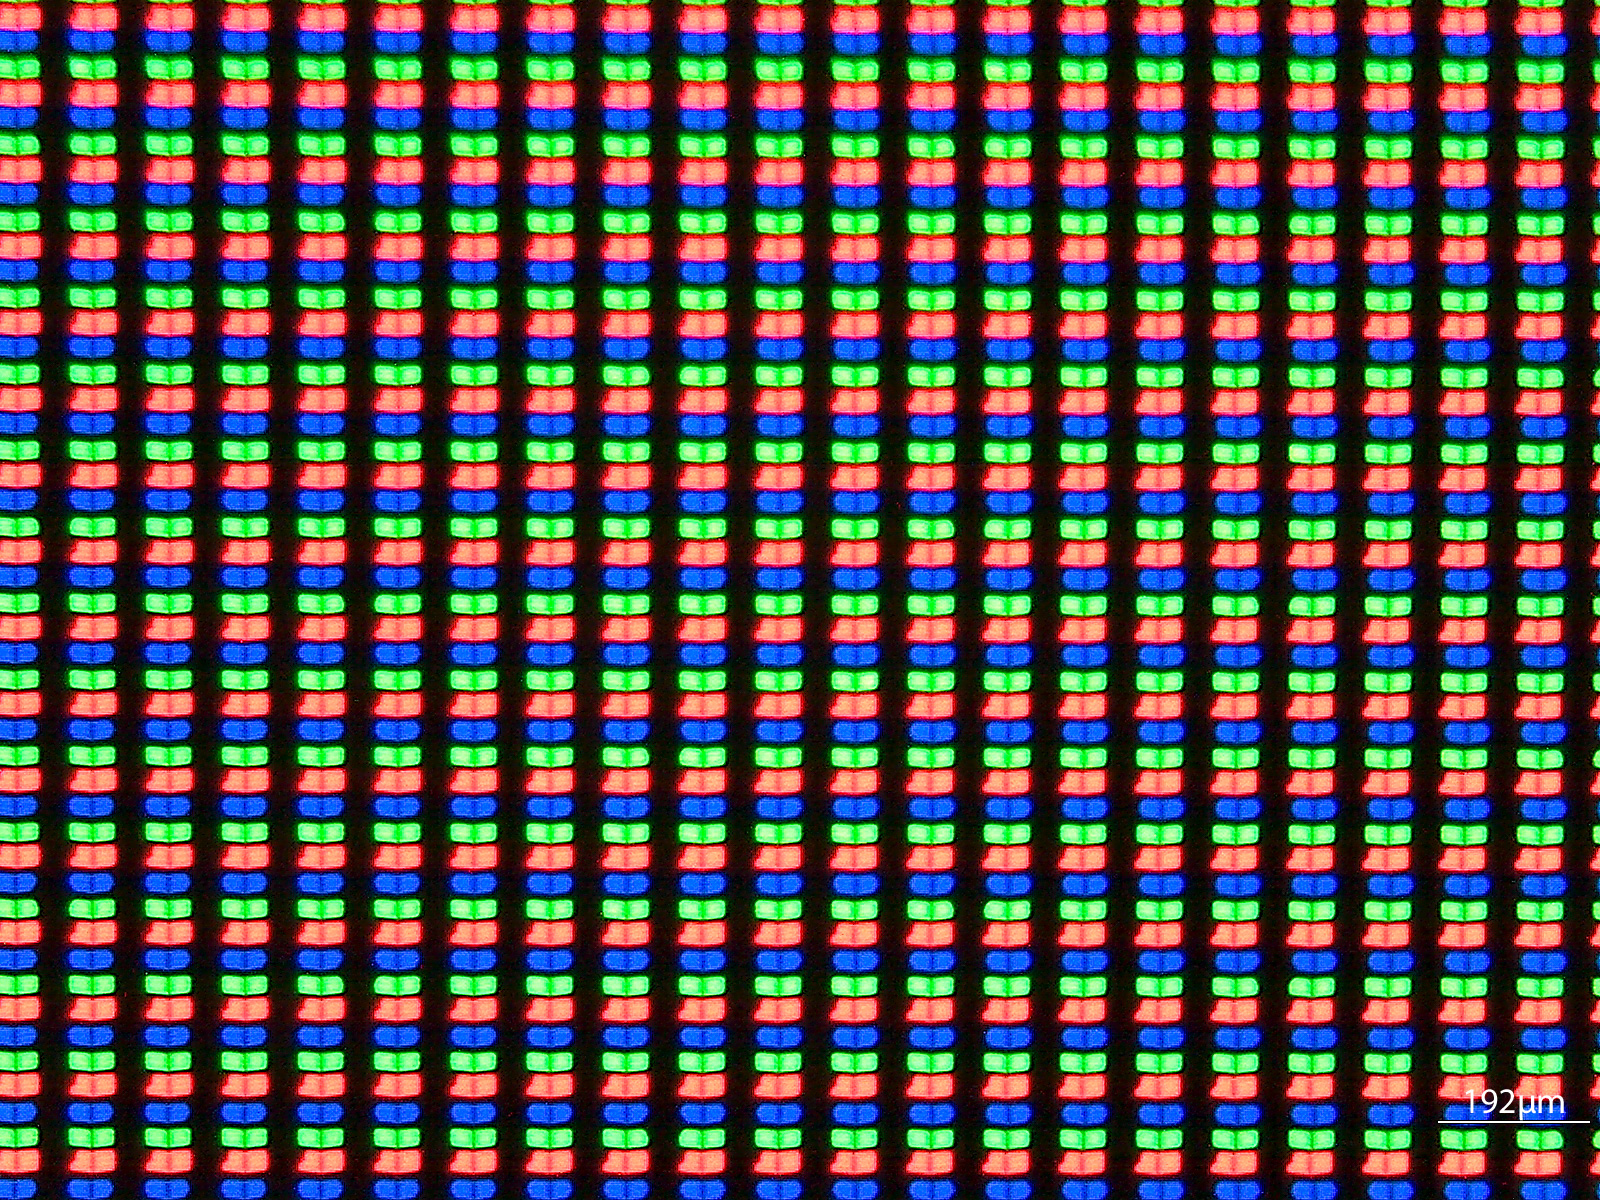
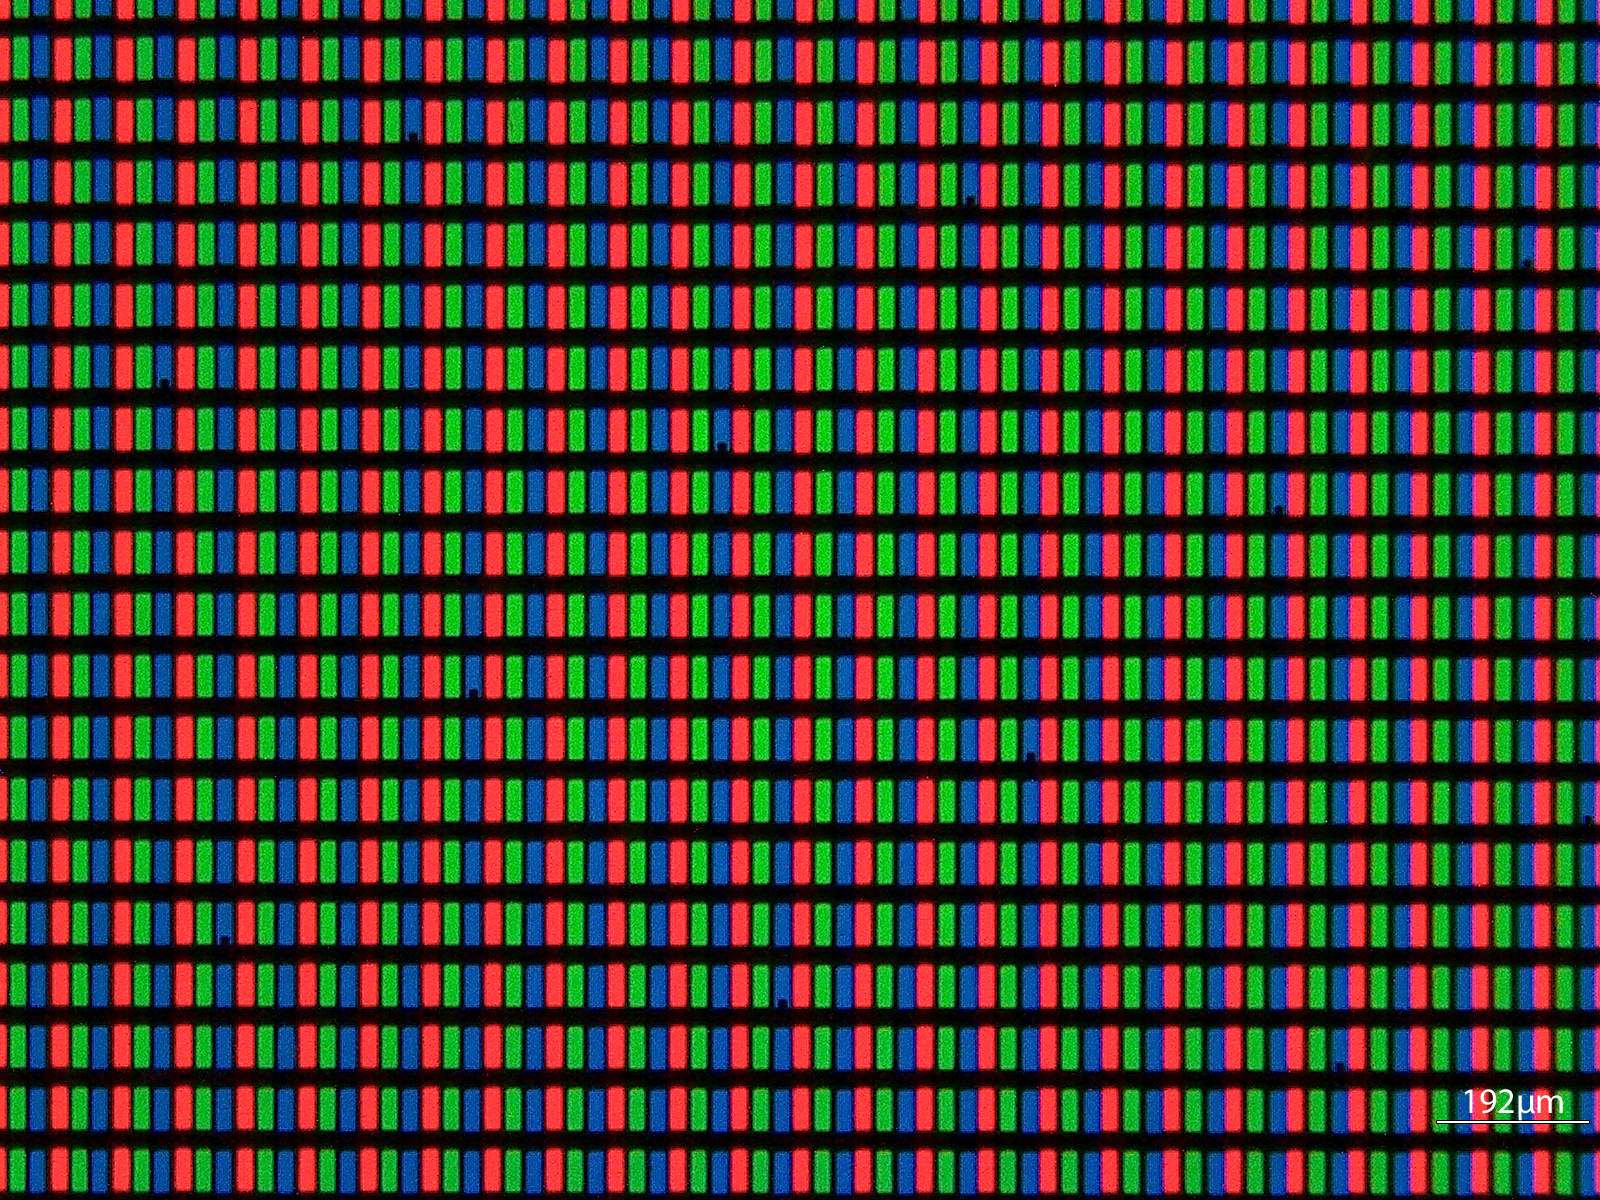
If we take a few (or an order of magnitude) more steps closer to the display and put it under the microscope we can get an even better appreciation for exactly what Samsung (and Apple's other display vendors) have done with the creation of this panel. Below are shots at 50x magnification of the display from the iPad 2, new iPad, ASUS TF Prime and iPhone 4S, organized from lowest to highest DPI:
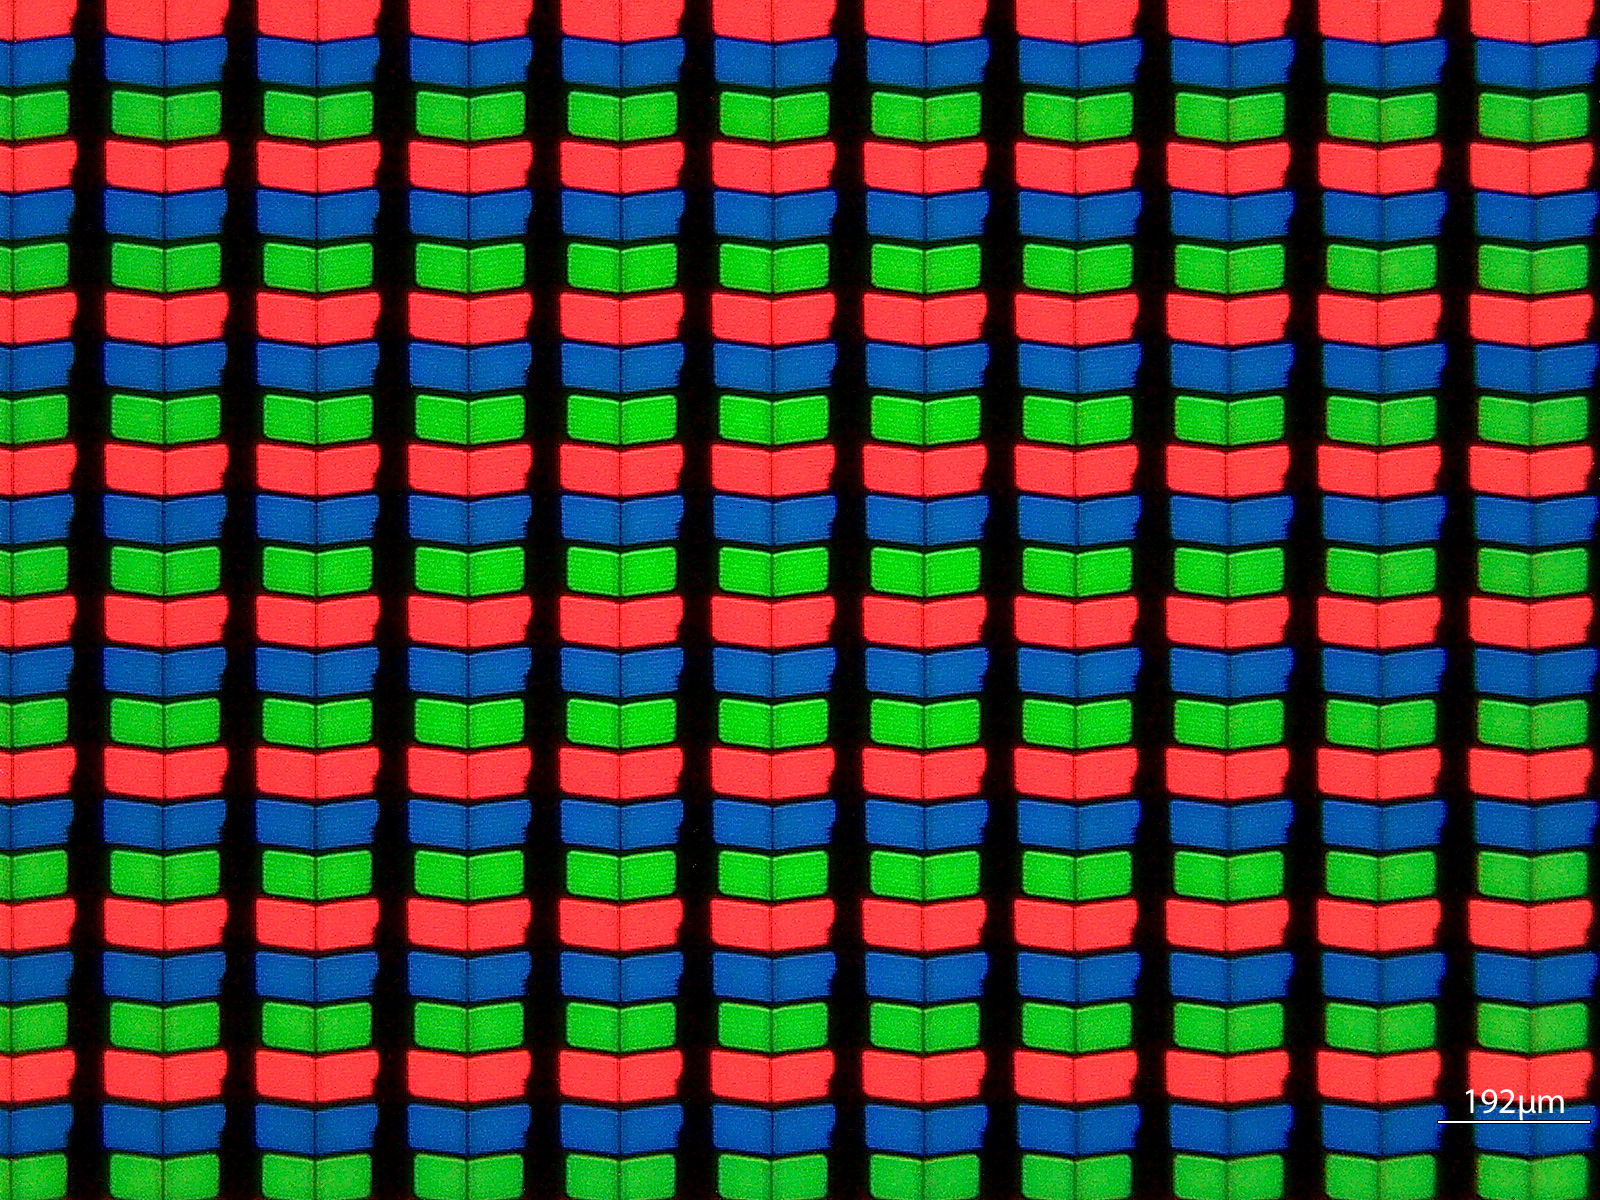
Apple iPad 2, 1024 x 768, 9.7-inches
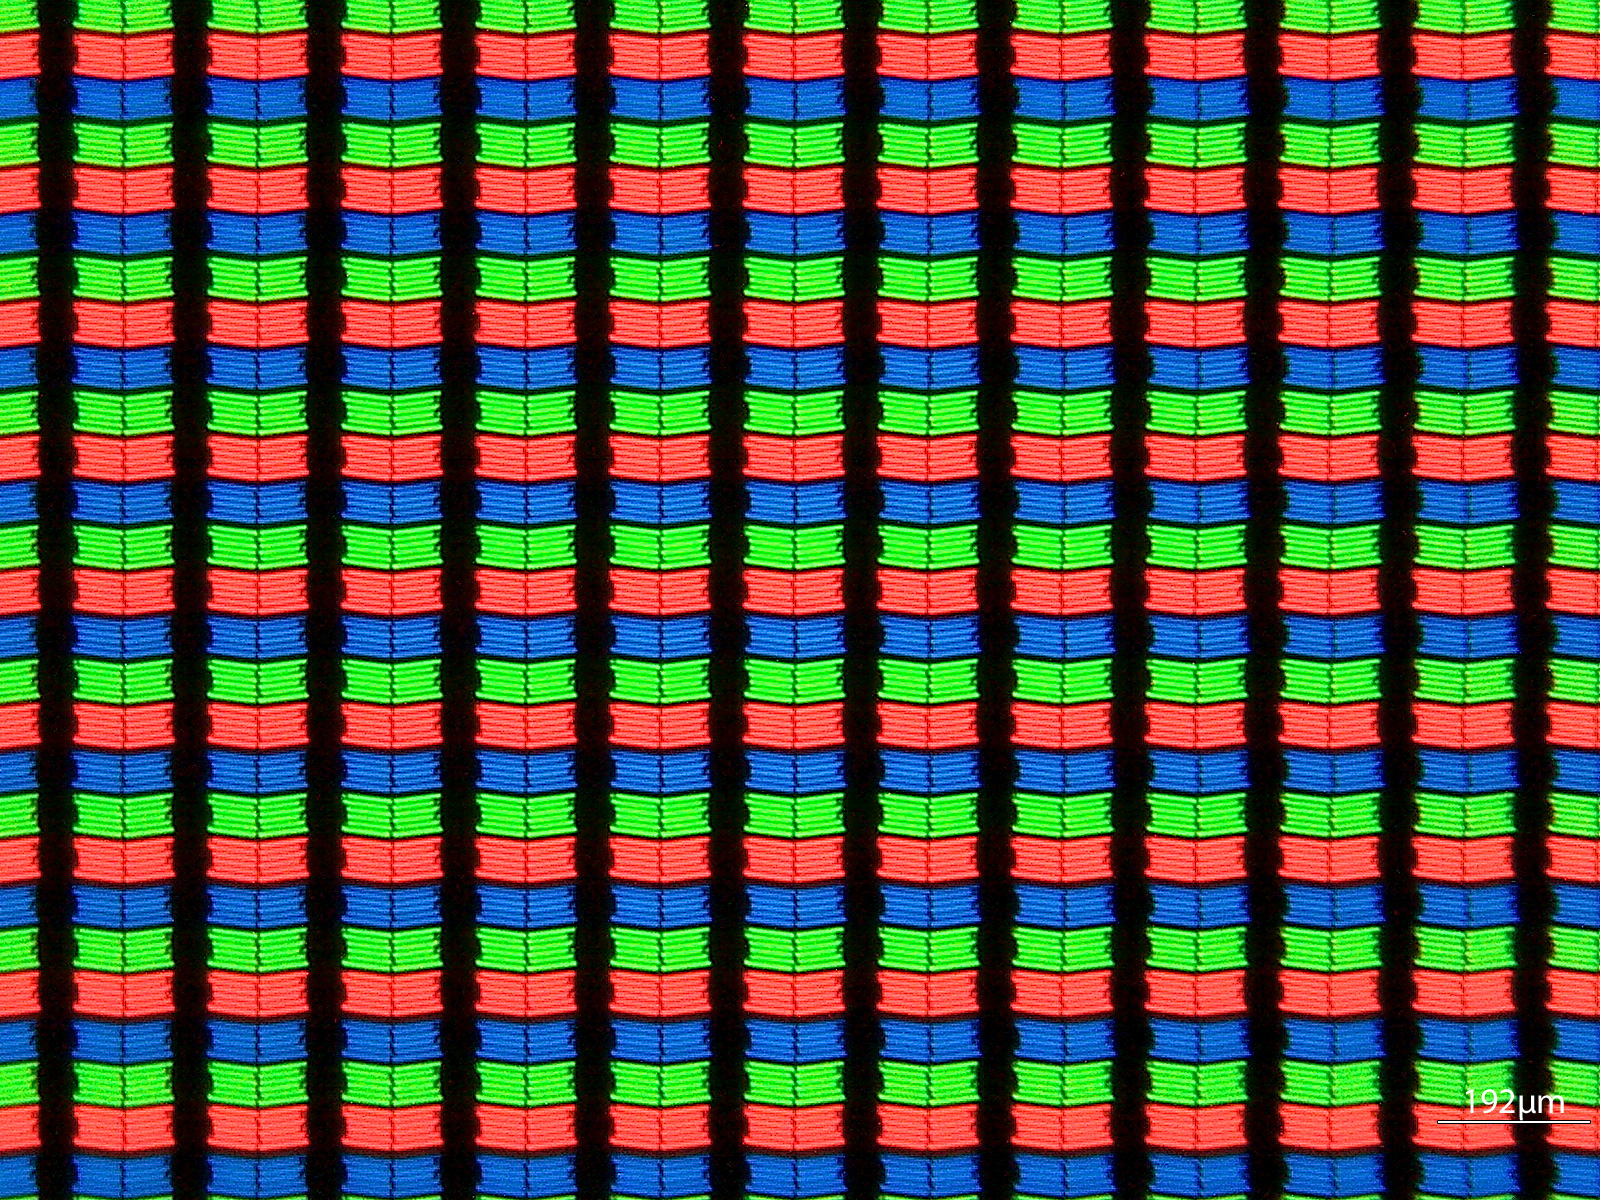
ASUS Eee Pad Transformer Prime, 1280 x 800, 10.1-inches
Apple iPad Retina Display (2012), 2048 x 1536, 9.7-inches
Apple iPhone 4S, 960 x 640, 3.5-inches
What you're looking at here are shots of the three subpixels for each pixel. Subpixel shapes will vary by panel type/manufacturer (hence the iPhone 4S vs. iPad subpixel structure), but the increase in density is tremendous.


172 Comments
View All Comments
Original Idea - Wednesday, March 21, 2012 - link
Can you share the formula used to calculate the PPI used in your graph. It seems that while the raw PPI is off by ~25% if using H*W/Size.Thanks for sharing.
valnar - Wednesday, March 21, 2012 - link
Thank you Apple for keeping the aspect ratio at 4:3. It makes it usable in both directions.