The Plextor M3 (256GB) Review
by Kristian Vättö on April 5, 2012 3:05 AM ESTRandom and Sequential Read/Write Speed
The four corners of SSD performance are as follows: random read, random write, sequential read and sequential write speed. Random accesses are generally small in size, while sequential accesses tend to be larger and thus we have the four Iometer tests we use in all of our reviews. Our first test writes 4KB in a completely random pattern over an 8GB space of the drive to simulate the sort of random access that you'd see on an OS drive (even this is more stressful than a normal desktop user would see). We perform three concurrent IOs and run the test for 3 minutes. The results reported are in average MB/s over the entire time. We use both standard pseudo randomly generated data for each write as well as fully random data to show you both the maximum and minimum performance offered by SandForce based drives in these tests. The average performance of SF drives will likely be somewhere in between the two values for each drive you see in the graphs. For an understanding of why this matters, read our original SandForce article.
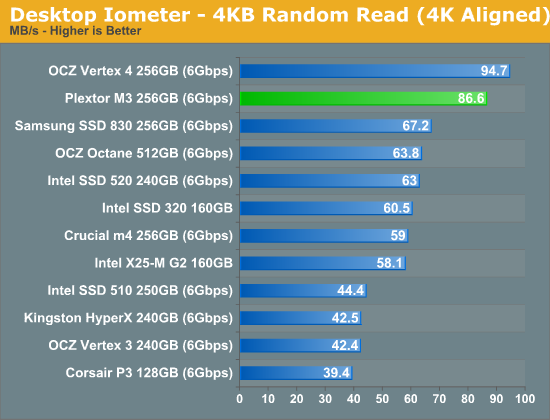
Plextor M3 provides very good 4KB random read performance. Looking at the Crucial m4 that uses the same Marvell controller, the Plextor M3 is 47% faster in random performance, so Plextor has clearly paid attention to their firmware.
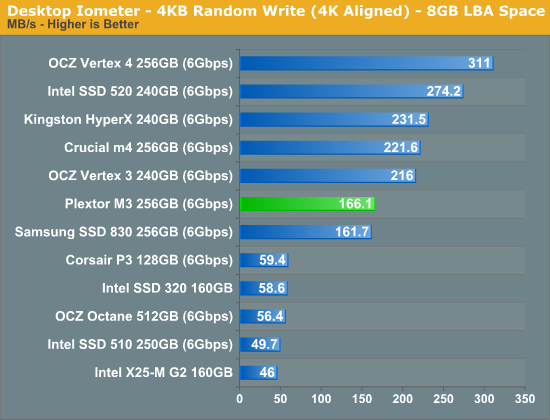
Random write performance is not as great as random read but still quite good enough for most workloads. This time Crucial's m4 comes out 33% faster than the M3, while the SF-2281 drives are all faster as well—write less data thanks to realtime compression and data deduplication techniques and your write speeds should generally be faster.
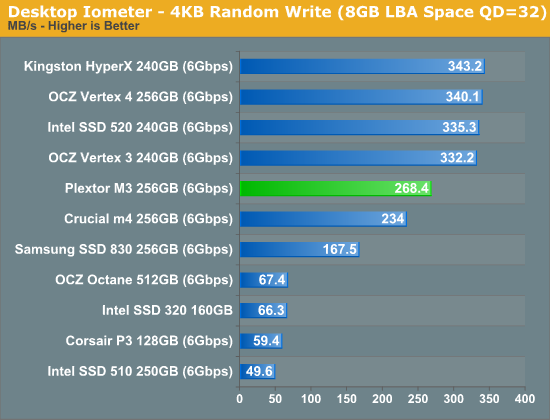
Switching the queue depth to 32 shows the difference between SandForce and non-SandForce quite well. SandForce is in its own class but among the Marvell SSDs, the Plextor M3 is the fastest. It's important to note that only heavy I/O workloads use queue depths that reach 32; most usage models don't go over 5.
Sequential Read/Write Speed
To measure sequential performance we ran a one minute long 128KB sequential test over the entire span of the drive at a queue depth of 1. The results reported are in average MB/s over the entire test length.
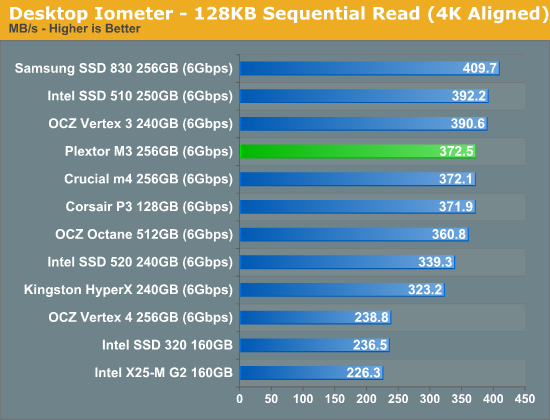
Sequential read speed is identical to Crucial m4 and Corsair P3, and good if not class leading for a SATA 6Gbps SSD.
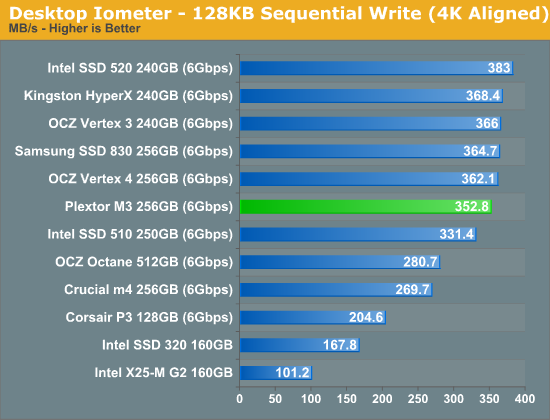
In sequential write speeds, the M3 is once again the fastest Marvell based SSD and is only a few percent behind SandForce based SSDs.


113 Comments
View All Comments
jwilliams4200 - Thursday, April 5, 2012 - link
I know it is Anand's fault and you are just parroting his erroneous statements, but you guys really need to do better with your steady-state testing. Sandforce is actually among the worst at steady-state performance, and Plextor M3(P) is the best of the consumer SSDs at steady-state performance.anandtech.com should use some version of the SNIA steady-state testing protocol.
Using HDTach is just crazy, since it writes a stream of zeros that is easily compressed by Sandforce SSDs, and thus does not give a good indication of steady-state performance (which SNIA specifies should be tested with random data streams). Besides, the workload of sequential writes spaced across the entire SSD is not realistic at all.
Here are a couple reviews that do a decent job of steady-state testing (could be better, but at least they are far superior to anandtech.com's terrible testing protocols):
scroll down to "Enterprise Synthetic Benchmarks" and look at the "... steady average speed" graphs for steady-state performance:
http://www.storagereview.com/plextor_pxm3p_ssd_rev...
http://www.xbitlabs.com/articles/storage/display/m...
bji - Thursday, April 5, 2012 - link
Jarred and Kristin, I know you guys are reading these comments ... I think you would do very well to respond to this comment. You guys are doing great articles but this looks like something you should definitely consider if you want to be more accurate on steady-state performance.I personally very much care about this issue as the last thing I want is for my drive to fall into JMicron style performance holes. One of the factors that I used in deciding to get the Intel 520s that I got a few weeks ago was the fact that your tests showed that under torture situations the performance is still good. If your tests are not accurate, then I think you really need to address this.
Beenthere - Thursday, April 5, 2012 - link
I use a variety of sources for SSD reviews. Storage Reviews uses some different metrics that may be of interest to those trying to make sense of SSD performance as the benches often do NOT mirror real world performance.To me the Plextor M3 just isn't where it needs to be. The M3 Pro should be the entry level Plextor SSD IMO. It's performance is a little better but currently it's over-priced. It should be priced as the M3 is now.
http://www.storagereview.com/reviews
Anand Lal Shimpi - Thursday, April 5, 2012 - link
Note that we don't use the HDTach approach for SandForce TRIM testing and instead fill the drive with incompressible data, throw incompressible random writes at the drive, and then use AS-SSD to measure incompressible write speed afterwards.Note that fully random data patterns are absolutely not indicative of client workloads at all. What you are saying is quite correct for certain enterprise applications, but not true in the consumer client space (this is also why we have a different enterprise SSD testing suite). IOs in the consumer space end up being a combination of pseudo-random and sequential, but definitely not fully random and definitely not fully random over 100% of the LBA space.
SandForce actually behaves very well over the long run for client workloads as we've mentioned in the past. We have seen write amplification consistently below 1x for client workloads, which is why the SF drives do so very well in client systems where TRIM isn't present.
Our current recommendation for an environment like OS X however continues to be Samsung's SSD 830. Its firmware tends to be a lot better behaved under OS X (for obvious reasons given Samsung's close relationship with Apple), regardless of write amplification and steady state random write behavior.
Take care,
Anand
jwilliams4200 - Thursday, April 5, 2012 - link
"Note that we don't use the HDTach approach for SandForce TRIM testing and instead fill the drive with incompressible data, throw incompressible random writes at the drive, and then use AS-SSD to measure incompressible write speed afterwards."What?
Are you really saying that you test Sandforce SSDs differently from non-Sandforce SSDs, and then you compare the results?
Surely the first rule any decent tester learns is that all devices must be tested in the same way if you are to have a prayer of comparing results.
Anand Lal Shimpi - Thursday, April 5, 2012 - link
We don't directly compare the TRIM/torture-test results, they are simply used as a tool to help us characterize the drive and understand the controller's garbage collection philosophies. HDTach (or an equivalent) is typically for doing that on non-SF drives because you can actually visualize high latency GC routines (dramatic peaks/valleys).The rest of the numbers are directly comparable.
Take care,
Anand
jwilliams4200 - Thursday, April 5, 2012 - link
So your reviews should not make comments comparing the steady-state performance of Sandforce drives to non-Sandforce drives, since you have no objective basis of comparison.SNIA guidelines for SSD testing clearly state that the "tests shall be run with a random data pattern". Other review sites that do steady-state testing comply with this protocol.
anandtech.com is urgently in need of improving its steady-state test protocols and complying with industry standard testing guidelines, since currently anandtech.com is making misleading statements about the relative performance of SSDs in steady-state tests
Anand Lal Shimpi - Thursday, April 5, 2012 - link
As I mentioned before, we have done extensive long term analysis of SandForce drives and came away with a very good understanding of their behavior in client workloads - that's the feedback that's folded into reviews. For client workloads, SF drives have extremely good steady-state characteristics since a lot of data never gets written to NAND (I've mentioned this in previous articles, pointing to sub-1x write amplification factors after several months of regular use).We use both incompressible and compressible data formats in our tests, as well as have our own storage suites that provide a mixture of both. No client system relies on 100% random data patterns or 100% random data access, it's simply not the case. We try our best to make our client tests representative of client workloads.
Our enterprise test suite does look different however, and included within it is a random write steady state test scenario. Even within the enterprise world it is not representative of all workloads, but there are some where it's an obvious fit.
Take care,
Anand
jwilliams4200 - Thursday, April 5, 2012 - link
"As I mentioned before, we have done extensive long term analysis of SandForce drives and came away with a very good understanding of their behavior in client workloads - that's the feedback that's folded into reviews."And as I have explained before, your tests are flawed. You do NOT have a good understanding, because you are unable to specify the actual data that was written to the SSDs during your testing. You are just guessing.
All other studies that have looked at compressibility of data written to Sandforce SSDs in typical consumer workloads have shown that most data is incompressible. The only common data that is compressible is OS and program installs, but that is only done once for most users. Probably your testers were installing lots of programs and OS's and running benchmarks that write easily compressible data, but that is not typical of most consumers. But the bottom line is that you seem to have no idea of what was actually written in your "analysis". So you really do not have a good understanding.
Day to day, most home users write Office documents (automatically compressed before saving), MP3 files, JPGs, compressed video files, and hibernation files (automatically compressed in Win7). All of these are incompressible to sandforce.
But none of that is really relevant to the question of how to test SSDs. The fact is that the only non-arbitrary way to do it is to use random, incompressible data patterns. There is a reason the industry standard SSD test protocols defined by SNIA specify mandatory random data patterns -- because that is the only completely objective test.
Anand Lal Shimpi - Thursday, April 5, 2012 - link
Again - we do use incompressible data patterns for looking at worst case performance on SF drives.There's no impact on incompressible vs. compressible data with these other controllers, so the precondition, high-QD torture, HDTach pass is fine for other drives.
As far as our internal experiment goes - we did more than just install/uninstall programs for 3 - 8 months. Each editor was given a SandForce drive and many of them used the drives as their boot/application drive for the duration of the study. My own personal workstation featured a SF drive for nearly a year, average write amplification over the course of that year was under 0.7x. My own workload involves a lot of email, video editing, photo editing, web browsing, HTML work, some software development, Excel, lots of dealing with archives, presentations, etc... I don't know that I even installed a single application during the test period as I simply cloned my environment over.
We also measured fairly decent write amplification for our own server workloads with Intel's SSD 520.
Take care,
Anand