The AMD Llano Notebook Review: Competing in the Mobile Market
by Jarred Walton & Anand Lal Shimpi on June 14, 2011 12:01 AM ESTApplications, Round Two: Treading Water
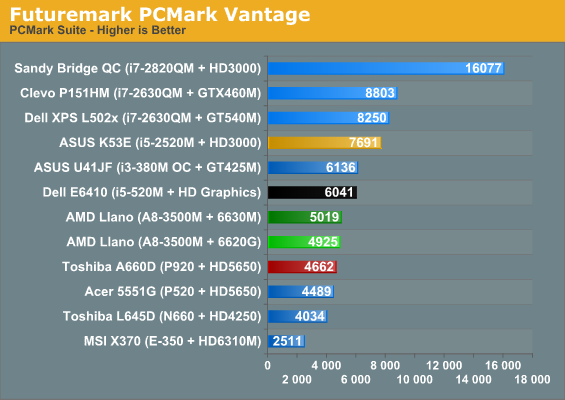
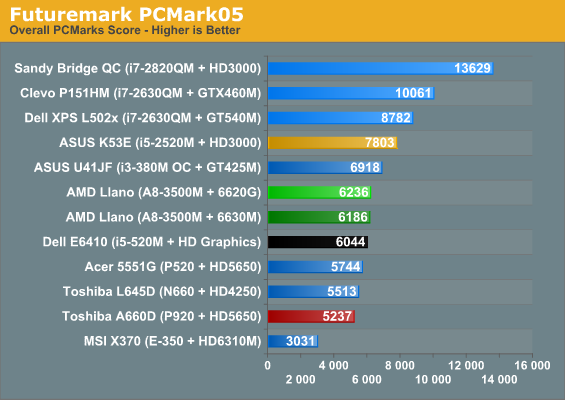
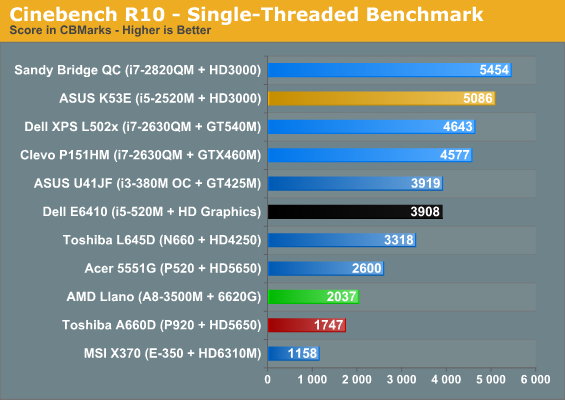
This time we have a more interesting competitor to look at: the Toshiba A660D. AMD says Turbo Core works at speeds of up to 2.4GHz on the A8-3500M, but we have no way of monitoring the actual CPU clocks right now. (CPU-Z if you’re wondering shows a constant 1.5GHz, but AMD says that utility doesn’t currently detect the proper clocks.) When we compare performance results between the Llano notebook and the A660D, we definitely see some differences in performance. Some of that may come from the added L2 cache and other architectural tweaks, but Cinebench R10 in particular shows a healthy 17% performance increase, even with a base clock that’s 7% lower. In the multi-threaded Cinebench result, the lead drops to 10%, which correlates well with how we’d expect Turbo Core to work. PCMark Vantage is still heavily influenced by the storage subsystem, and the storage score of 2950 on the A660D versus 3791 on the Llano suggests the Toshiba HDD is a significant bottleneck.
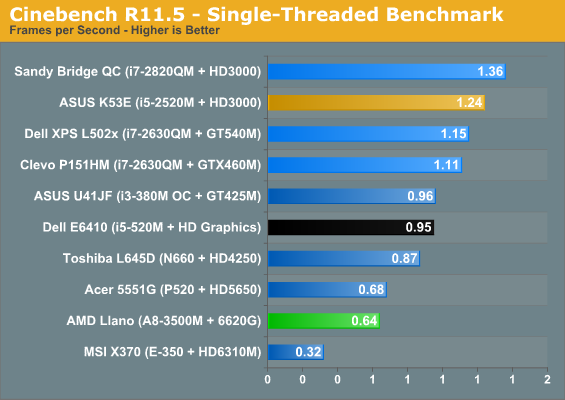
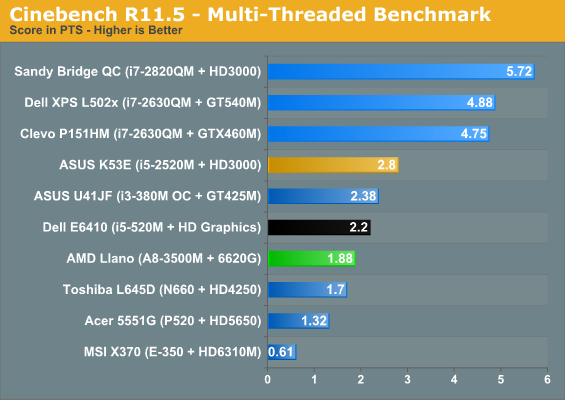
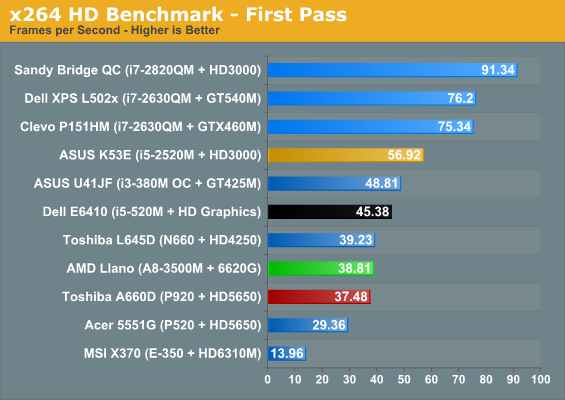
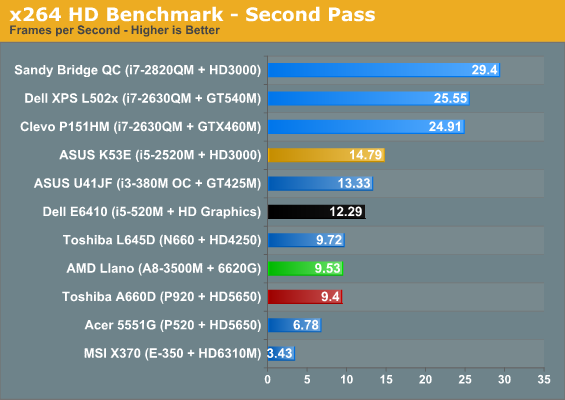
Looking at other laptops and tests where we’re looking purely at CPU performance, suddenly Llano starts to struggle. The Arrandale i5-520M offers 92% higher single-threaded performance in Cinebench R10 and 48% better single-threaded performance in R11.5; multi-threaded performance also goes to Arrandale, with a 23% lead in R10 and 17% lead in R11.5. x264 also gives Arrandale a decent lead, with i5-520M 17% faster in the first pass and 29% faster in the more intense second pass. The overclocked i3-380M in ASUS’ U41JF tells a similar tale—and both of these laptops are running processors from early last year. When we shift to Sandy Bridge, even without looking at the quad-core parts AMD’s CPU performance is tenuous. The i5-2520M is anywhere from 50 to 150 percent faster depending on which test we look at; even if we toss out the older Cinebench R10 single-threaded result of 150%, R11.5 given the 2520M a 94% lead. In general, then, a moderate dual-core Sandy Bridge i5-series processor looks to be at least 30% faster, so quad-core Llano really only competes with Core i3 and its lower, non-Turbo clocks.
None of the results here are particularly surprising; K10.5 even at 32nm is still largely the same performance. AMD has focused this round up upgrades more on reducing power consumption rather than increasing performance, and that’s a perfectly reasonable approach for a mobile CPU. Most of us probably aren’t doing 3D rendering, CAD/CAM, or unassisted video transcoding on our laptops anyway. It would still be great to see AMD offer up an equivalent to Intel’s Quick Sync; they have the better GPU architecture, but a dedicated decoder like Quick Sync can clearly pay dividends. Outside of that one deficit the reality is that Llano is still plenty fast. Slapping an SSD into Llano will make more of a difference than upgrading an HDD-based Llano laptop to Core i5, so if you’re looking for an inexpensive laptop that can do everything most users need, Llano is very appealing.


177 Comments
View All Comments
ET - Tuesday, June 14, 2011 - link
Legit Reviews found a big difference in game performance between AC and battery (see here: http://www.legitreviews.com/article/1636/5/). This made Llano and the i5 perform about the same on battery in Resident Evil 5. I assume that benchmarks here are on AC, so it would be interesting to test on battery.DXM1 - Tuesday, June 14, 2011 - link
Great Review Anand! Once again we know intel is the best at all things computing. I liked how you included the i7 with 460m up to THREE times in some benchmarks. It was like you kept reminding us and casual consumers that massively more expensive parts perform better... Even if you test the same set-up 3 times in a row!I have to tell you that seeing the 3 intel blue bars on the top made me sigh with relief, I was worried that you may actually compare llano to the parts like i3 and i5 where it is actually meant to compete (like some other silly reviewers). My only gripe is you didnt add i7-2600kand gtx 580 OC'ed as those would have made the gap even wider from the AMD system.
One question I did have for you is, how much does Intel pay nowadays for dishonest reviewing practices? Im short on cash because my job doesnt pay well and I was hoping to open up a website and promote intel just like you. Maybe we could even become partners and link to each other websites I think that would be cool.
PS, could you post how much your integrity was worth before you auctioned it off to Intel? Im sure some of your fans would be eager to know.
Your ex Reader, DXM1
Sharken03 - Tuesday, June 14, 2011 - link
Dont feed this troll, Anandtech is a great hardware site.Jamahl - Tuesday, June 14, 2011 - link
Troll? it's the truth. What was the fucking point in showing 3x identical intel systems except to put 3x intel systems at the top of most benchmarks? It's goddam pathetic.JarredWalton - Tuesday, June 14, 2011 - link
Or, I included these laptops because they're the only ones I still had where I could rerun all the benchmarks (specifically, PCMark 7 and 3DMark 11). Oh, snap! Heaven forbid we think about that. And if you read the 8000+ words of commentary, you'll notice how often we praise Intel's placement at the top of the charts -- and of course we completely ignore when they fall to the bottom of the battery life charts.I wish I had a secret stash of all the laptops I've tested in the last six months, because then I wouldn't have even bothered with including more than one GTX 460M + SNB. But your suggestion that we *not* include laptops because it pushes Llano down is even worse than what we've done. Should we only show laptops where AMD is better? Or maybe just laptops that cost under $700? Maybe we need to dig out an old CULV setup and then benchmark GMA 4500MHD again so we can laugh at Intel's IGP from two years ago?
If you want a look at every laptop we've tested and where Llano falls in the grand scheme of things, I suggest checking into our Mobile Bench results. Hint: it's in the upper part of battery life, and in the middle to lower part of CPU and GPU tests; if you only look at IGPs, though, it's the fastest IGP. Hmm... that sounds a lot like what we said in our conclusion.
pfastovsky - Tuesday, June 14, 2011 - link
JarredI think its a fair comment that asks Anandtech to keep their graphs in an article consistent with the same laptop set across a testing segment. As you said, you had to rerun all the benchmarks so why are the Civ laptops listed so different from Mass Effect, Starcraft etc?
Thanks
ET - Tuesday, June 14, 2011 - link
The comment may be fair, and it's been mentioned before, but accusing Anandtech of being paid by Intel isn't.krumme - Tuesday, June 14, 2011 - link
None of this explains the 3 identical setup.How on earth to you think it looks like?
Its simply utterly pathetic, and an insult at our IQ
I am no fan at this Llano apu, and from the start. think AMD should just have posponed it, and used the capacity for BD and serverspace, but this review is just far out.
The important issue about llano have always been the power profile, and AMD just deliver in spades here. Far beyound expectations. The OEM will sell this like zakate, and the new trinity will not make it significantly better on the market than this with upgraded star cores.
JarredWalton - Tuesday, June 14, 2011 - link
You know what's utterly pathetic and an insult to people's IQ? The suggestion that they can't actually comprehend the graphs. But just to show you that I have no "agenda" and I'm not trying to make AMD's Llano look worse than it is, I have taken a couple hours to go through, remove all the extra data, and regenerate all the graphs. (Yes, folks, creating all of these things does take time and our UI for doing this is not as easy as you might expect.) Of course, not all of the i7-2630QM + GTX 460M notebooks performed equally, so now I've "punished" Intel by showing worse results in some tests. Oh noes!Anyway, thanks for the input and sorry if the inclusion of more laptops was deemed offensive by some. They're just charts, people, and I even colored the "high-end" laptops bright blue so that you could easily filter them out in your mind. You know, something like: "Oh, those lines at the top are bright blue, so they're for quad-core Sandy Bridge laptops that cost about twice what the Llano laptop is expected to cost."
AnandThenMan - Tuesday, June 14, 2011 - link
Although I don't like the approach of the poster taking issue with the graphs, I completely agree on principle. This site has shown a clear pattern of making sure certain hardware always occupies the top of the graphs. Always. And don't insult our intelligence and pretend otherwise, please.Need I also remind people that this site included hand picked, overclocked Nvidia supplied cards (to the insistence of Nvidia) despite a policy that forbids this. I would caution people to take all results on this site with a grain of salt.