The 2011 Mid-Range SSD Roundup: 120GB Agility 3, Intel 510 and More Compared
by Anand Lal Shimpi on June 7, 2011 12:52 PM ESTAnandTech Storage Bench 2011
I didn't expect to have to debut this so soon, but I've been working on updated benchmarks for 2011. Last year we introduced our AnandTech Storage Bench, a suite of benchmarks that took traces of real OS/application usage and played them back in a repeatable manner. I assembled the traces myself out of frustration with the majority of what we have today in terms of SSD benchmarks.
Although the AnandTech Storage Bench tests did a good job of characterizing SSD performance, they weren't stressful enough. All of the tests performed less than 10GB of reads/writes and typically involved only 4GB of writes specifically. That's not even enough exceed the spare area on most SSDs. Most canned SSD benchmarks don't even come close to writing a single gigabyte of data, but that doesn't mean that simply writing 4GB is acceptable.
Originally I kept the benchmarks short enough that they wouldn't be a burden to run (~30 minutes) but long enough that they were representative of what a power user might do with their system.
Not too long ago I tweeted that I had created what I referred to as the Mother of All SSD Benchmarks (MOASB). Rather than only writing 4GB of data to the drive, this benchmark writes 106.32GB. It's the load you'd put on a drive after nearly two weeks of constant usage. And it takes a *long* time to run.
I'll be sharing the full details of the benchmark in some upcoming SSD articles but here are some details:
1) The MOASB, officially called AnandTech Storage Bench 2011 - Heavy Workload, mainly focuses on the times when your I/O activity is the highest. There is a lot of downloading and application installing that happens during the course of this test. My thinking was that it's during application installs, file copies, downloading and multitasking with all of this that you can really notice performance differences between drives.
2) I tried to cover as many bases as possible with the software I incorporated into this test. There's a lot of photo editing in Photoshop, HTML editing in Dreamweaver, web browsing, game playing/level loading (Starcraft II & WoW are both a part of the test) as well as general use stuff (application installing, virus scanning). I included a large amount of email downloading, document creation and editing as well. To top it all off I even use Visual Studio 2008 to build Chromium during the test.
Update: As promised, some more details about our Heavy Workload for 2011.
The test has 2,168,893 read operations and 1,783,447 write operations. The IO breakdown is as follows:
| AnandTech Storage Bench 2011 - Heavy Workload IO Breakdown | ||||
| IO Size | % of Total | |||
| 4KB | 28% | |||
| 16KB | 10% | |||
| 32KB | 10% | |||
| 64KB | 4% | |||
Only 42% of all operations are sequential, the rest range from pseudo to fully random (with most falling in the pseudo-random category). Average queue depth is 4.625 IOs, with 59% of operations taking place in an IO queue of 1.
Many of you have asked for a better way to really characterize performance. Simply looking at IOPS doesn't really say much. As a result I'm going to be presenting Storage Bench 2011 data in a slightly different way. We'll have performance represented as Average MB/s, with higher numbers being better. At the same time I'll be reporting how long the SSD was busy while running this test. These disk busy graphs will show you exactly how much time was shaved off by using a faster drive vs. a slower one during the course of this test. Finally, I will also break out performance into reads, writes and combined. The reason I do this is to help balance out the fact that this test is unusually write intensive, which can often hide the benefits of a drive with good read performance.
There's also a new light workload for 2011. This is a far more reasonable, typical every day use case benchmark. Lots of web browsing, photo editing (but with a greater focus on photo consumption), video playback as well as some application installs and gaming. This test isn't nearly as write intensive as the MOASB but it's still multiple times more write intensive than what we were running last year.
As always I don't believe that these two benchmarks alone are enough to characterize the performance of a drive, but hopefully along with the rest of our tests they will help provide a better idea.
The testbed for Storage Bench 2011 has changed as well. We're now using a Sandy Bridge platform with full 6Gbps support for these tests. All of the older tests are still run on our X58 platform.
AnandTech Storage Bench 2011 - Heavy Workload
We'll start out by looking at average data rate throughout our new heavy workload test:
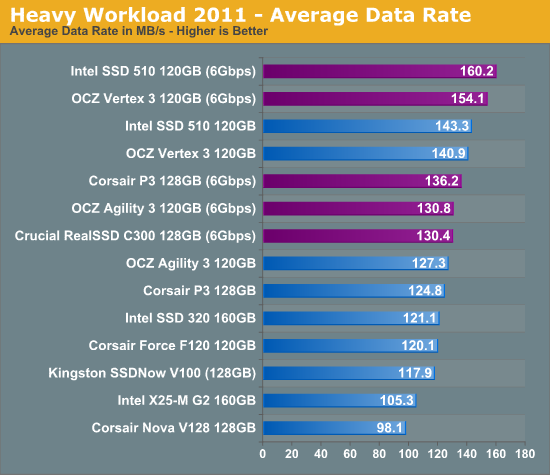
What SandForce has done with the SF-2281 controller is very impressive when you look at these results. Keep in mind that our Heavy Workload is the most write-heavy of our new benchmarks and it uses a lot of data that's already compressed (images, videos, file archives). Despite the makeup of the workload, the SF-2281 based Vertex 3 is nearly the fastest drive here - outpacing both the P3 and C300. The Agility 3, with its asynchronous NAND isn't quite as strong and is actually outpaced by Corsair's P3.
Intel's 160GB SSD 320 is a 3Gbps SATA drive and thus it can't compete with the 6Gbps offerings near the top. If we only look at 3Gbps results however, the standings aren't all that impressive. The 320, P3 and Agility 3 all fall within the same performance group, with the Vertex 3 clearly pulling ahead.
There's another drive from Intel however that does manage to impress: the Intel SSD 510. At 250GB, the 510 isn't competitive with OCZ's 240GB Vertex 3 however at 120GB the tests tell a different story. OCZ loses the ability to interleave reads/writes on a per device basis and thus takes a pretty significant performance hit. It's likely all of the incompressible data in this workload that really forces a difference between the 240GB and 120GB Vertex 3s. The 510 however doesn't have that problem, and the 120GB drive actually outperforms the Vertex 3 here. Not to mention that it should be more reliable if history is any indication.
The breakdown of reads vs. writes tells us more of what's going on:
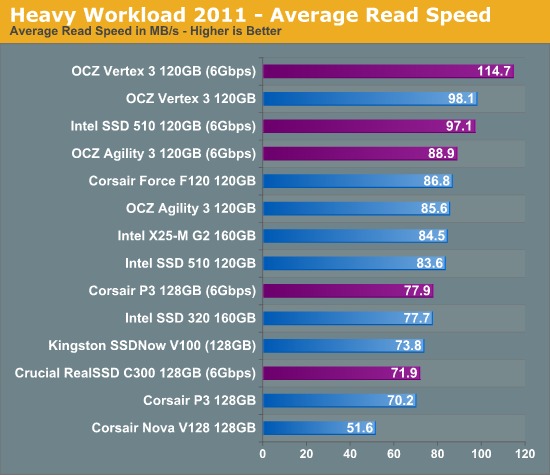
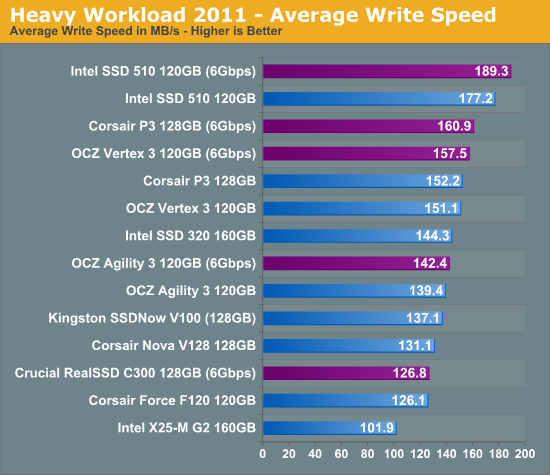
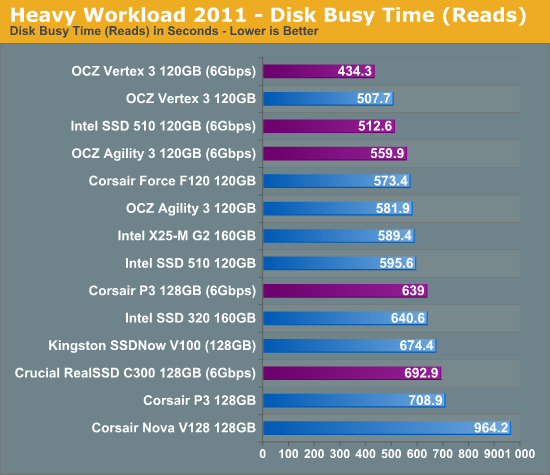
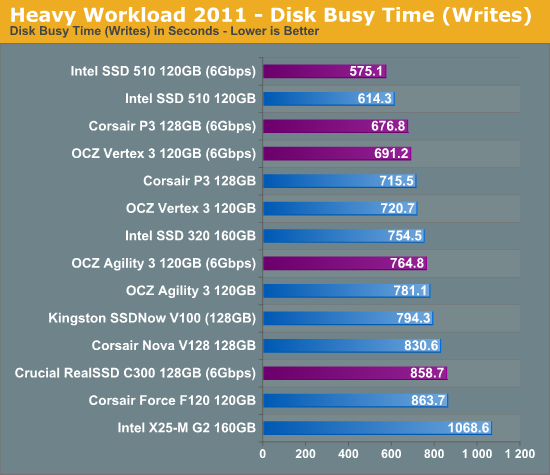
Read performance is where the Vertex 3 really makes up most of its advantage. At 114.7MB/s the Vertex 3 is nearly 30% faster than the Agility 3 here. Write speed however is a closer race between all of the drives:
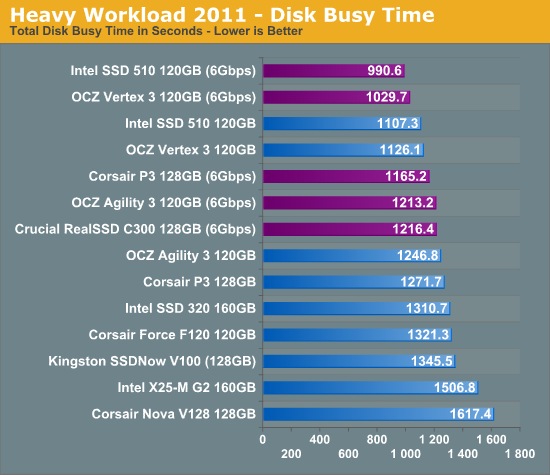
The next three charts just represent the same data, but in a different manner. Instead of looking at average data rate, we're looking at how long the disk was busy for during this entire test. Note that disk busy time excludes any and all idles, this is just how long the SSD was busy doing something:


68 Comments
View All Comments
JasonInofuentes - Tuesday, June 7, 2011 - link
"It's funny how little the recommendations have changed over the years. Intel still offers a good balance of performance and reliability, however if you're willing to take a risk on the reliability front you can get better value elsewhere."http://www.anandtech.com/show/2738
scook9 - Tuesday, June 7, 2011 - link
Looks good. I recently got a 160GB Intel 320 drive for my M18x but since it has Sata 6Gbps I am going to be pretty tempted to trade up to a 510 down the road. Just could not get excited over that $$/GB for nowStargrazer - Tuesday, June 7, 2011 - link
Awesome. Thanks.(first (non-french) comparison of current-gen ~128GB SSDs I've seen)
apexjr - Tuesday, June 7, 2011 - link
Anand,Thank you for this! This is exactly what I have been waiting for.
dhanson8652 - Tuesday, June 7, 2011 - link
The chart labels on page 5 are conflicting with both charts being labeled read/write write/read with the inverse white on orange text being correct and the black on orange text being incorrect.Anand Lal Shimpi - Tuesday, June 7, 2011 - link
Fixed :)Oxford Guy - Thursday, June 9, 2011 - link
240 GB Vertex 2 at some point... prettie please?You talk about the 240 GB drives offering best case performance. Don't you think people would like to know how good the performance of the 240 GB Vertex 2 is in comparison with 120 GB next-gen units like these?
apexjr - Tuesday, June 7, 2011 - link
For me this article gives weight to the research I have done and the hours reading and analyzing other reviews.For the laptop I had chose the Intel 510 because it has the least power draw idle, 6 Gbps and a proven track record of reliability.
For my gaming machine I had chose the Vertex 3 240gb. Even with the reliability issues that might happen I have nightly backups running (Easy to setup with Windows 7) and spare drives to swap in should something happen.
Confusador - Tuesday, June 7, 2011 - link
One of the things that's held me back from getting an SSD is that I always have at least 2 OSes installed, and a common data partition. Can anyone point me at info on how these drives handle that? I can't find anywhere that Anand has covered it in his roundups. I'd like to know how it affects performance, but what I'm really concerned about is drive life, if the partitioning interferes with the controller's ability to optimize wear leveling.cgeorgescu - Tuesday, June 7, 2011 - link
It's amazing how a Corsair Force F120 (or some Vertex2) still manages to not be beaten that hard by these new arrivals. In pure benchmarks, the new drives have some impressive results but, as long as we're speaking about real-life scenarios, F120 suddenly appears in the graph not far under the new drives.