OCZ Agility 3 (240GB) Review
by Anand Lal Shimpi on May 24, 2011 2:53 AM ESTAnandTech Storage Bench 2011
I didn't expect to have to debut this so soon, but I've been working on updated benchmarks for 2011. Last year we introduced our AnandTech Storage Bench, a suite of benchmarks that took traces of real OS/application usage and played them back in a repeatable manner. I assembled the traces myself out of frustration with the majority of what we have today in terms of SSD benchmarks.
Although the AnandTech Storage Bench tests did a good job of characterizing SSD performance, they weren't stressful enough. All of the tests performed less than 10GB of reads/writes and typically involved only 4GB of writes specifically. That's not even enough exceed the spare area on most SSDs. Most canned SSD benchmarks don't even come close to writing a single gigabyte of data, but that doesn't mean that simply writing 4GB is acceptable.
Originally I kept the benchmarks short enough that they wouldn't be a burden to run (~30 minutes) but long enough that they were representative of what a power user might do with their system.
Not too long ago I tweeted that I had created what I referred to as the Mother of All SSD Benchmarks (MOASB). Rather than only writing 4GB of data to the drive, this benchmark writes 106.32GB. It's the load you'd put on a drive after nearly two weeks of constant usage. And it takes a *long* time to run.
I'll be sharing the full details of the benchmark in some upcoming SSD articles but here are some details:
1) The MOASB, officially called AnandTech Storage Bench 2011 - Heavy Workload, mainly focuses on the times when your I/O activity is the highest. There is a lot of downloading and application installing that happens during the course of this test. My thinking was that it's during application installs, file copies, downloading and multitasking with all of this that you can really notice performance differences between drives.
2) I tried to cover as many bases as possible with the software I incorporated into this test. There's a lot of photo editing in Photoshop, HTML editing in Dreamweaver, web browsing, game playing/level loading (Starcraft II & WoW are both a part of the test) as well as general use stuff (application installing, virus scanning). I included a large amount of email downloading, document creation and editing as well. To top it all off I even use Visual Studio 2008 to build Chromium during the test.
Update: As promised, some more details about our Heavy Workload for 2011.
The test has 2,168,893 read operations and 1,783,447 write operations. The IO breakdown is as follows:
| AnandTech Storage Bench 2011 - Heavy Workload IO Breakdown | ||||
| IO Size | % of Total | |||
| 4KB | 28% | |||
| 16KB | 10% | |||
| 32KB | 10% | |||
| 64KB | 4% | |||
Only 42% of all operations are sequential, the rest range from pseudo to fully random (with most falling in the pseudo-random category). Average queue depth is 4.625 IOs, with 59% of operations taking place in an IO queue of 1.
Many of you have asked for a better way to really characterize performance. Simply looking at IOPS doesn't really say much. As a result I'm going to be presenting Storage Bench 2011 data in a slightly different way. We'll have performance represented as Average MB/s, with higher numbers being better. At the same time I'll be reporting how long the SSD was busy while running this test. These disk busy graphs will show you exactly how much time was shaved off by using a faster drive vs. a slower one during the course of this test. Finally, I will also break out performance into reads, writes and combined. The reason I do this is to help balance out the fact that this test is unusually write intensive, which can often hide the benefits of a drive with good read performance.
There's also a new light workload for 2011. This is a far more reasonable, typical every day use case benchmark. Lots of web browsing, photo editing (but with a greater focus on photo consumption), video playback as well as some application installs and gaming. This test isn't nearly as write intensive as the MOASB but it's still multiple times more write intensive than what we were running last year.
As always I don't believe that these two benchmarks alone are enough to characterize the performance of a drive, but hopefully along with the rest of our tests they will help provide a better idea.
The testbed for Storage Bench 2011 has changed as well. We're now using a Sandy Bridge platform with full 6Gbps support for these tests. All of the older tests are still run on our X58 platform.
AnandTech Storage Bench 2011 - Heavy Workload
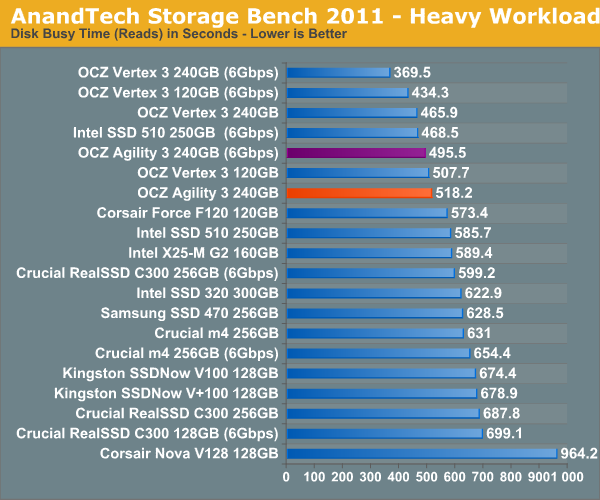
We'll start out by looking at average data rate throughout our new heavy workload test:
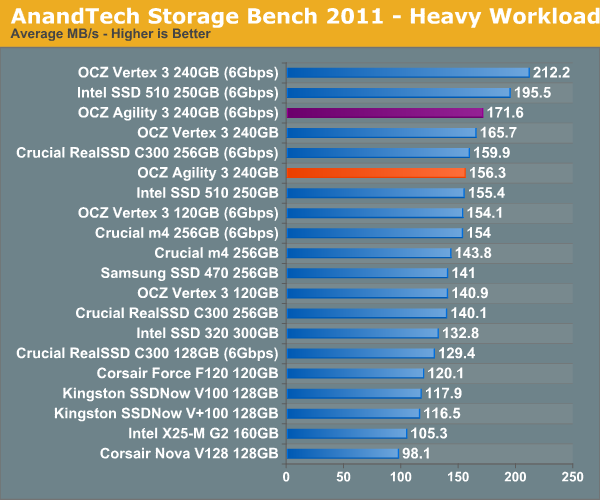
Our heavy workload has quite a bit of compressed reads/writes, which are where the Agility 3 is going to struggle the most. The 240GB Agility 3 performs more like an Intel SSD 510 here rather than a Vertex 3. The Agility 3 is still a respectable performer, definitely faster than the old Vertex 2, but it's definitely not as quick as the new Vertex 3.
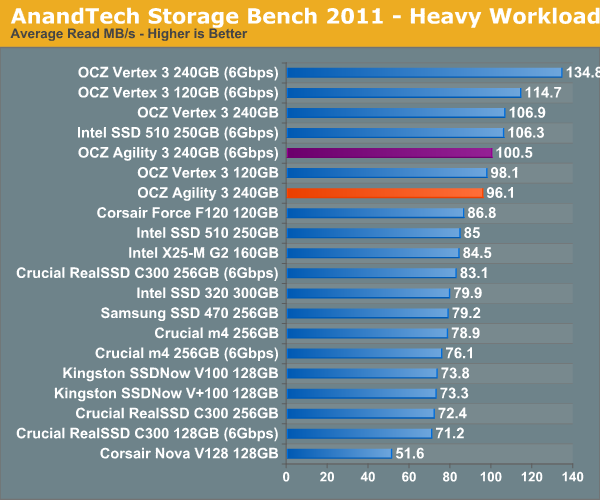
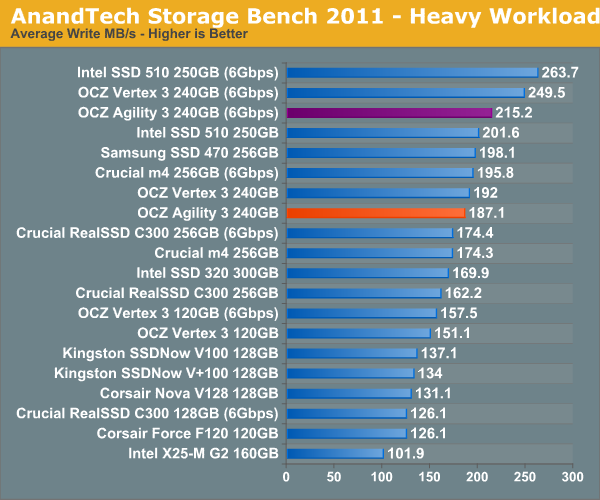
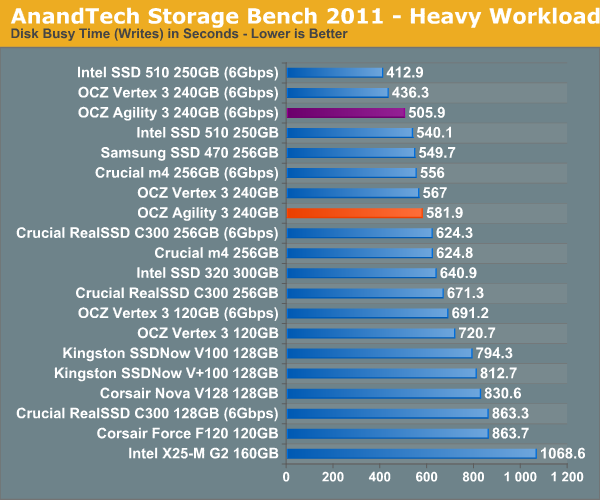
The breakdown of reads vs. writes tells us more of what's going on:
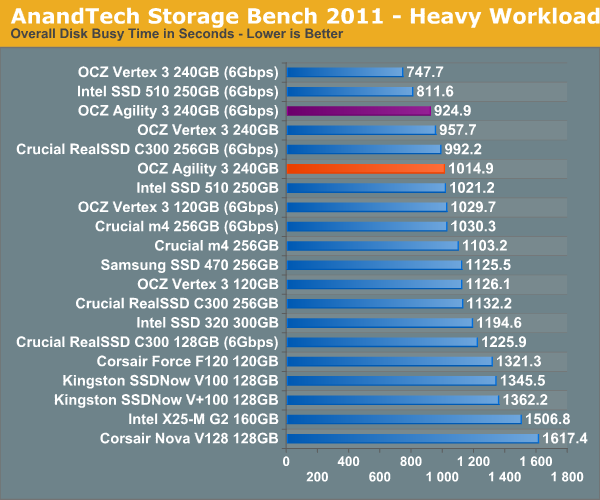
The next three charts just represent the same data, but in a different manner. Instead of looking at average data rate, we're looking at how long the disk was busy for during this entire test. Note that disk busy time excludes any and all idles, this is just how long the SSD was busy doing something:


59 Comments
View All Comments
Shadowmaster625 - Tuesday, May 24, 2011 - link
A pair of 60GB Agility 2 costs a lot less and should mop the floor with these. We need sata 3 like we needed sata 2 in 2005.Arbie - Tuesday, May 24, 2011 - link
Other sites can provide useful comparative info on SSDs, but what really sets Anandtech apart is depth of knowledge and especially the custom test suites you have developed. They tell the story that I as a home desktop user need to know, and nobody else has anything like them.eric appla - Tuesday, May 24, 2011 - link
I wonder if OCZ did something to improve reliability. I have Vertex 2 and it is pain in the back part of my body. I have already third as I had to RMA two of them already and big reseller shops are reporting return ratios as high as 15% for OCZ vertex II series.I wish I never bought it really. Especially in combination with DELL laptop it looks like total fail.
bji - Tuesday, May 24, 2011 - link
Yeah I stay away from OCZ products because I have read far too many anecdotal stories like yours, especially in the reviews of OCZ products on newegg, to feel comfortable buying anything from OCZ. All manufacturers have a percentage of failed parts and that's to be expected; but OCZ always seems to have alot more reports of problems than other vendors. Until that changes for a while, I will not buy anything from OCZ.LuvKush - Tuesday, May 24, 2011 - link
I agree, we really want to see the corsair force 3 or GT's in action 120gb version and 240gb Thanks Anand. Been waiting for those reviews. Also is the 128gb M4 suffer the same fate as the ocz vertex 3 120gb version? as the nands are cut in half and lost performance too? I have the crucial m4 128gb and would love to know if the performance loss is as bad as the 120gb vertex 3 is to the 240gb vertex 3. Thanks again!StuffOfInterest - Tuesday, May 24, 2011 - link
I'd like to see the 60GB Agility benchmarked in a Z68 Smart Response Technology (SRT) configuration. The early tests of SRT showed quite a few tradeoffs between R/W performanc and capacity. Having a SATA-III drive right at the size max for SRT could provide for an interesting comparison against Intels 311 which was designed specifically for SRT.iwod - Tuesday, May 24, 2011 - link
Sequential read performance is lower than the Vertex 3. The 240GB Agility 3 performs more like a 120GB Vertex 2 than its 240GB sibling.Shouldn't it be 120GB Vertex 3?
iwod - Tuesday, May 24, 2011 - link
It would be much more interesting to see how 60GB perform, especially against the Crucial M4 64GB SSD.Oxford Guy - Tuesday, May 24, 2011 - link
I don't understand why this isn't included in the charts, particularly the current "E" model with 25nm 64-bit NAND.Oxford Guy - Tuesday, May 24, 2011 - link
In fact, there isn't a single Vertex 2 drive in these charts. It's bizarre.People would like to see how the 240 GB Vertex 2 fares against the Vertex 3.