OWC Mercury Extreme Pro 6G SSD Review (120GB)
by Anand Lal Shimpi on May 5, 2011 1:45 AM ESTAnandTech Storage Bench 2011
I didn't expect to have to debut this so soon, but I've been working on updated benchmarks for 2011. Last year we introduced our AnandTech Storage Bench, a suite of benchmarks that took traces of real OS/application usage and played them back in a repeatable manner. I assembled the traces myself out of frustration with the majority of what we have today in terms of SSD benchmarks.
Although the AnandTech Storage Bench tests did a good job of characterizing SSD performance, they weren't stressful enough. All of the tests performed less than 10GB of reads/writes and typically involved only 4GB of writes specifically. That's not even enough exceed the spare area on most SSDs. Most canned SSD benchmarks don't even come close to writing a single gigabyte of data, but that doesn't mean that simply writing 4GB is acceptable.
Originally I kept the benchmarks short enough that they wouldn't be a burden to run (~30 minutes) but long enough that they were representative of what a power user might do with their system.
Not too long ago I tweeted that I had created what I referred to as the Mother of All SSD Benchmarks (MOASB). Rather than only writing 4GB of data to the drive, this benchmark writes 106.32GB. It's the load you'd put on a drive after nearly two weeks of constant usage. And it takes a *long* time to run.
I'll be sharing the full details of the benchmark in some upcoming SSD articles but here are some details:
1) The MOASB, officially called AnandTech Storage Bench 2011 - Heavy Workload, mainly focuses on the times when your I/O activity is the highest. There is a lot of downloading and application installing that happens during the course of this test. My thinking was that it's during application installs, file copies, downloading and multitasking with all of this that you can really notice performance differences between drives.
2) I tried to cover as many bases as possible with the software I incorporated into this test. There's a lot of photo editing in Photoshop, HTML editing in Dreamweaver, web browsing, game playing/level loading (Starcraft II & WoW are both a part of the test) as well as general use stuff (application installing, virus scanning). I included a large amount of email downloading, document creation and editing as well. To top it all off I even use Visual Studio 2008 to build Chromium during the test.
Update: As promised, some more details about our Heavy Workload for 2011.
The test has 2,168,893 read operations and 1,783,447 write operations. The IO breakdown is as follows:
| AnandTech Storage Bench 2011 - Heavy Workload IO Breakdown | ||||
| IO Size | % of Total | |||
| 4KB | 28% | |||
| 16KB | 10% | |||
| 32KB | 10% | |||
| 64KB | 4% | |||
Only 42% of all operations are sequential, the rest range from pseudo to fully random (with most falling in the pseudo-random category). Average queue depth is 4.625 IOs, with 59% of operations taking place in an IO queue of 1.
Many of you have asked for a better way to really characterize performance. Simply looking at IOPS doesn't really say much. As a result I'm going to be presenting Storage Bench 2011 data in a slightly different way. We'll have performance represented as Average MB/s, with higher numbers being better. At the same time I'll be reporting how long the SSD was busy while running this test. These disk busy graphs will show you exactly how much time was shaved off by using a faster drive vs. a slower one during the course of this test. Finally, I will also break out performance into reads, writes and combined. The reason I do this is to help balance out the fact that this test is unusually write intensive, which can often hide the benefits of a drive with good read performance.
There's also a new light workload for 2011. This is a far more reasonable, typical every day use case benchmark. Lots of web browsing, photo editing (but with a greater focus on photo consumption), video playback as well as some application installs and gaming. This test isn't nearly as write intensive as the MOASB but it's still multiple times more write intensive than what we were running last year.
As always I don't believe that these two benchmarks alone are enough to characterize the performance of a drive, but hopefully along with the rest of our tests they will help provide a better idea.
The testbed for Storage Bench 2011 has changed as well. We're now using a Sandy Bridge platform with full 6Gbps support for these tests. All of the older tests are still run on our X58 platform.
AnandTech Storage Bench 2011 - Heavy Workload
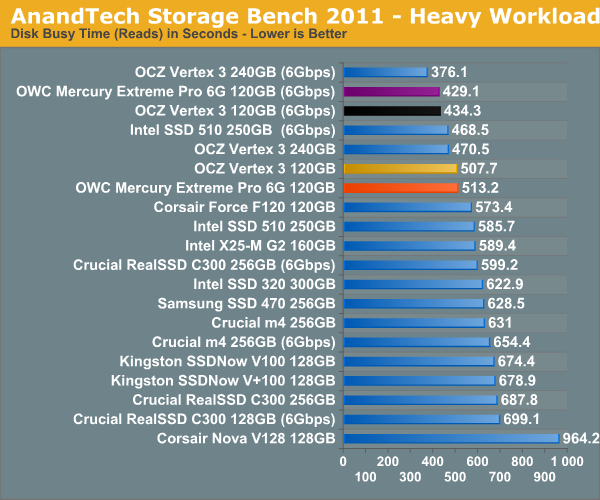
We'll start out by looking at average data rate throughout our new heavy workload test:
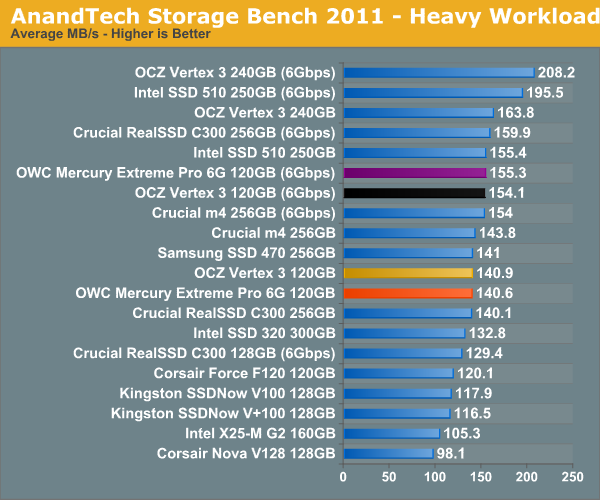
Overall performance is identical to the 120GB Vertex 3, but still behind the 240GB version due to the use of single-die NAND devices. At 240GB the choice is clear, but at 120GB I'm still waiting to get my hands on a few more drives before determining the best buy at that price point.
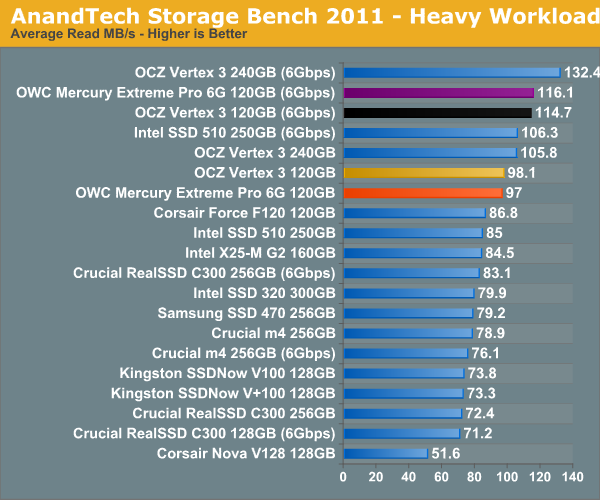
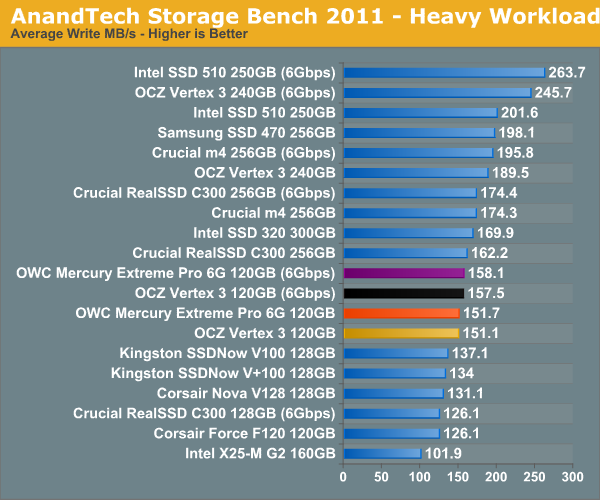
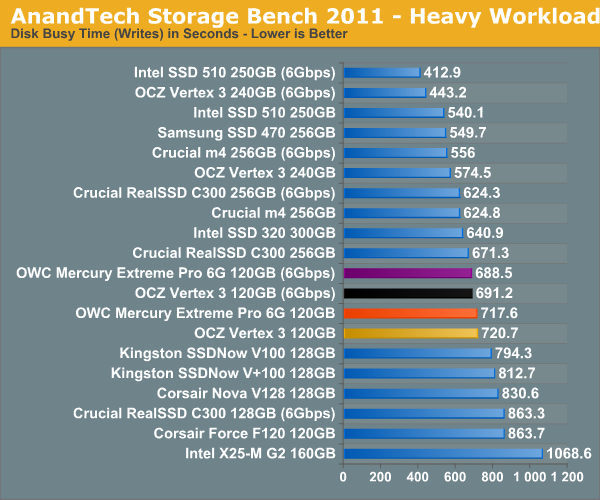
The breakdown of reads vs. writes tells us more of what's going on:
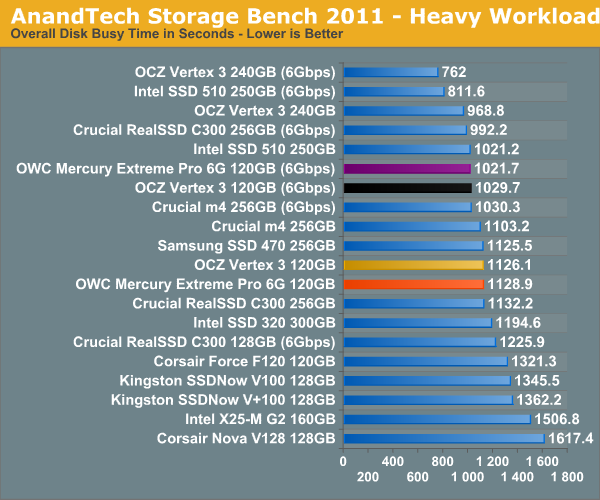
The next three charts just represent the same data, but in a different manner. Instead of looking at average data rate, we're looking at how long the disk was busy for during this entire test. Note that disk busy time excludes any and all idles, this is just how long the SSD was busy doing something:


44 Comments
View All Comments
wombat2k - Thursday, May 5, 2011 - link
"The two come with comparable warranties which brings the decision down to pricing, where OCZ currently has a $20 advantage. "I don't think that's the complete picture. OWC is more of a Mac shop so provides ways to easily update your firmware from a Mac. OCZ relies on you burning an ISO file. This might have changed for the Vertex 3, but I doubt it. OWC sells directly through macsales.com, and I hear their service is pretty good, so if you're a Mac owner, you would tend to naturally gravitate around the OWC solution, even with the price markup.
Disclaimer:
* Not a OWC user yet, but considering them *
NCM - Thursday, May 5, 2011 - link
The table on page 1 shows the same specs (other than price...) for all three versions.Shadowmaster625 - Thursday, May 5, 2011 - link
I paid $95 for my 60GB Agility 2. I cant fathom paying 3 times the money for 2X the capacity and a negligable increase in noticable performance.sor - Thursday, May 5, 2011 - link
I for one hope Anand will figure out what's up with the OCZ 'max iops' Vertex 3. Seems to me that he was promised that his test sample's performance would be the same as the shipping Vertex 3, and now we have a Vertex 3 with and without a firmware cap, and the firmware capped one was shipped first. Perhaps that's not the case and the 'max iops' is some new tweaks above and beyond, but it's been out a few weeks and so far I've yet to read anything about it anywhere.Mr Perfect - Thursday, May 5, 2011 - link
Isn't anyone making 64GB drives this generation? With the Z68 chipset reportedly only supporting up to 64G for the SSD/HD hybrid drive configuration, they're going to be in demand.Stargrazer - Thursday, May 5, 2011 - link
I would argue that you don't *have* any real world tests.
Sure, the AnandTech Storage Bench tests are *based on* real world workloads, but since you're playing them back at a faster than normal rate, they stop being real world tests. Just take the case of playing back a movie for example. You have a lot of reads there, but you don't get any increase in performance from being able to perform those reads faster than what is necessary to keep your buffers filled (non-empty really). In addition to this, many of the writes that are performed during the tests should be non-blocking, so increasing the write performance would in many cases not lead to any actual real world performance increases (you'd "free up" the drive faster, but that's mostly a benefit when there's other stuff that needs to be done).
There is presumably a lot of stuff in there that *is* limited by your IO speed, but it's all mixed up with stuff that *isn't*, so you can't tell which speed increases give a real world improvement, and which do not. You simply can't tell how much real world performance an increase in results represent, the relationship most certainly will not be linear (e.g. a 10 point difference could have different meaning depending on how high the values are), and you can't even conclusively tell that a drive that gets a higher score actually performs better in any real world sense.
The tests do provide some information, but it's not something that tells you how much you would benefit from upgrading your drive.
I personally think that it would be interesting if you would provide some *actual* real world tests too, so that people could tell if they would actually see some real world differences between different SSDs. Maybe some program/game loading/zoning tests?
At least people would then be able to judge if the difference they see would be significant enough (for them) to warrant an upgrade. You know how to value a 10s difference, but how much is a 10 MB/s difference in the storage bench worth?
Anand Lal Shimpi - Thursday, May 5, 2011 - link
Note that both the 2011 and 2010 Storage Bench do playback in real time. The 2011 benches in particular even preserve idle times properly so all that's sped up are actual I/O requests. You are correct in that this will speed up things like decoding video, however note that many video players already do a lot of read ahead and pre-decode on frames in order to avoid stuttering. Note that very few of the IOs in these tests are for things like video decode so I don't believe they're biasing the results too much.You are correct in that we're focusing exclusively on the I/O aspect of performance. And that a 10% increase in I/O performance won't result in a 10% increase in system performance (except in IO bound tasks).
I've toyed with doing timing based tests, the issue is that modern SSDs don't show any difference when measuring the launch time of a single application. It's really under heavy multitasking and behavior over time that they differ from one another. Both of these types of tests are very difficult to time in a repeatable fashion, which is why we turn to our trace based performance tools.
I do agree that there's a need for some perspective on these performance improvements, which is what I tried to do by including disk busy time in our 2011 results. There you can see that over the course of a 3 hour use period (for example in the case of the heavy workload) that one drive may shave off x number of seconds vs another drive. How annoying those seconds are is really up to the end user.
Personally I find that there are three categories that drives fall into these days. There are those that offer performance around that of an X25-M G2, the next group is around the Vertex 2 and the final group is the 6Gbps 240GB Vertex 3. I feel like there's a noticeable difference going from any one of those groups to the other, but going from an X25-M G2 to something that's slower than the Vertex 2 makes less sense.
I hope this helps :)
Take care,
Anand
seapeople - Thursday, May 5, 2011 - link
Considering that it's now a given that someone will ask for a graph of loading an application on the comments of any new SSD article, I think you should just pick 5 or 10 current drives and show everyone a graph that spans from 5.2 seconds to 5.5 seconds (or whatever it is) with a tag line of "There, are you happy? Now stop asking about this!"AnnonymousCoward - Thursday, May 5, 2011 - link
Real world tests shouldn't be a "There, are you happy?" afterthought. Real world is all that matters.Let me refer back to this classic example: http://tinyurl.com/yamfwmg . RAID0 was 20-38% faster in IOPS, and in the time-based comparison it was equal or slightly slower. Anand concluded "RAID-0 arrays will win you just about any benchmark, but they'll deliver virtually nothing more than that for real world desktop performance."
Do you buy an SSD to use it, or to sit there and run benchmarks?
Stargrazer - Thursday, May 5, 2011 - link
The chipset drivers are listed as being Intel 9.1.1.1015. Aren't those drivers from December 2009? Do they work well for H67?I can understand if you want to keep the same drivers for consistency in the tests, but have you checked if there are any significant performance benefits from using more recent drivers? If there are any changes, it could be interesting to see how it affects some of the more recent drives.