OWC Mercury Extreme Pro 6G SSD Review (120GB)
by Anand Lal Shimpi on May 5, 2011 1:45 AM ESTAnandTech Storage Bench 2011
I didn't expect to have to debut this so soon, but I've been working on updated benchmarks for 2011. Last year we introduced our AnandTech Storage Bench, a suite of benchmarks that took traces of real OS/application usage and played them back in a repeatable manner. I assembled the traces myself out of frustration with the majority of what we have today in terms of SSD benchmarks.
Although the AnandTech Storage Bench tests did a good job of characterizing SSD performance, they weren't stressful enough. All of the tests performed less than 10GB of reads/writes and typically involved only 4GB of writes specifically. That's not even enough exceed the spare area on most SSDs. Most canned SSD benchmarks don't even come close to writing a single gigabyte of data, but that doesn't mean that simply writing 4GB is acceptable.
Originally I kept the benchmarks short enough that they wouldn't be a burden to run (~30 minutes) but long enough that they were representative of what a power user might do with their system.
Not too long ago I tweeted that I had created what I referred to as the Mother of All SSD Benchmarks (MOASB). Rather than only writing 4GB of data to the drive, this benchmark writes 106.32GB. It's the load you'd put on a drive after nearly two weeks of constant usage. And it takes a *long* time to run.
I'll be sharing the full details of the benchmark in some upcoming SSD articles but here are some details:
1) The MOASB, officially called AnandTech Storage Bench 2011 - Heavy Workload, mainly focuses on the times when your I/O activity is the highest. There is a lot of downloading and application installing that happens during the course of this test. My thinking was that it's during application installs, file copies, downloading and multitasking with all of this that you can really notice performance differences between drives.
2) I tried to cover as many bases as possible with the software I incorporated into this test. There's a lot of photo editing in Photoshop, HTML editing in Dreamweaver, web browsing, game playing/level loading (Starcraft II & WoW are both a part of the test) as well as general use stuff (application installing, virus scanning). I included a large amount of email downloading, document creation and editing as well. To top it all off I even use Visual Studio 2008 to build Chromium during the test.
Update: As promised, some more details about our Heavy Workload for 2011.
The test has 2,168,893 read operations and 1,783,447 write operations. The IO breakdown is as follows:
| AnandTech Storage Bench 2011 - Heavy Workload IO Breakdown | ||||
| IO Size | % of Total | |||
| 4KB | 28% | |||
| 16KB | 10% | |||
| 32KB | 10% | |||
| 64KB | 4% | |||
Only 42% of all operations are sequential, the rest range from pseudo to fully random (with most falling in the pseudo-random category). Average queue depth is 4.625 IOs, with 59% of operations taking place in an IO queue of 1.
Many of you have asked for a better way to really characterize performance. Simply looking at IOPS doesn't really say much. As a result I'm going to be presenting Storage Bench 2011 data in a slightly different way. We'll have performance represented as Average MB/s, with higher numbers being better. At the same time I'll be reporting how long the SSD was busy while running this test. These disk busy graphs will show you exactly how much time was shaved off by using a faster drive vs. a slower one during the course of this test. Finally, I will also break out performance into reads, writes and combined. The reason I do this is to help balance out the fact that this test is unusually write intensive, which can often hide the benefits of a drive with good read performance.
There's also a new light workload for 2011. This is a far more reasonable, typical every day use case benchmark. Lots of web browsing, photo editing (but with a greater focus on photo consumption), video playback as well as some application installs and gaming. This test isn't nearly as write intensive as the MOASB but it's still multiple times more write intensive than what we were running last year.
As always I don't believe that these two benchmarks alone are enough to characterize the performance of a drive, but hopefully along with the rest of our tests they will help provide a better idea.
The testbed for Storage Bench 2011 has changed as well. We're now using a Sandy Bridge platform with full 6Gbps support for these tests. All of the older tests are still run on our X58 platform.
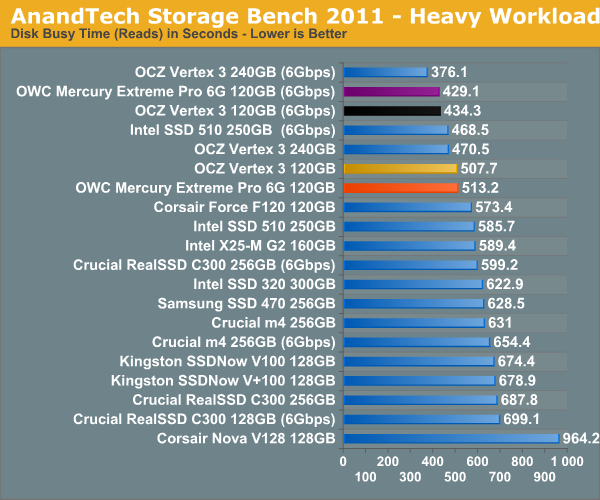
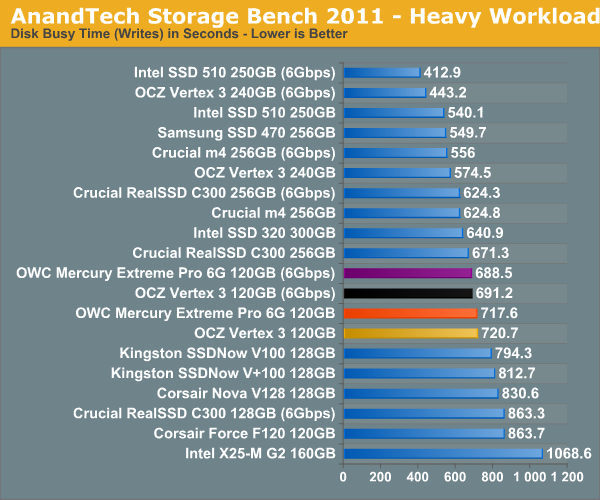
AnandTech Storage Bench 2011 - Heavy Workload
We'll start out by looking at average data rate throughout our new heavy workload test:
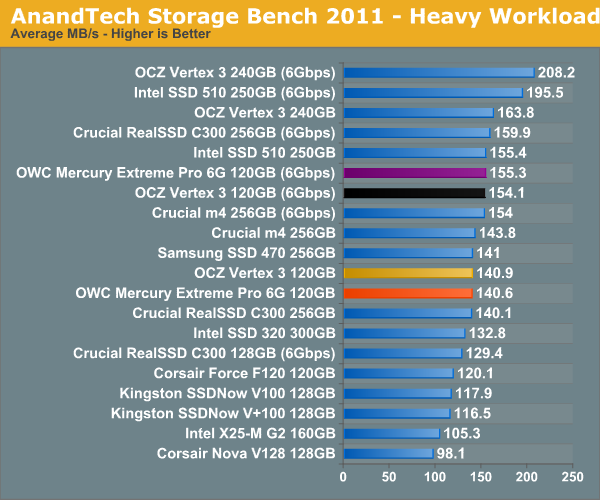
Overall performance is identical to the 120GB Vertex 3, but still behind the 240GB version due to the use of single-die NAND devices. At 240GB the choice is clear, but at 120GB I'm still waiting to get my hands on a few more drives before determining the best buy at that price point.
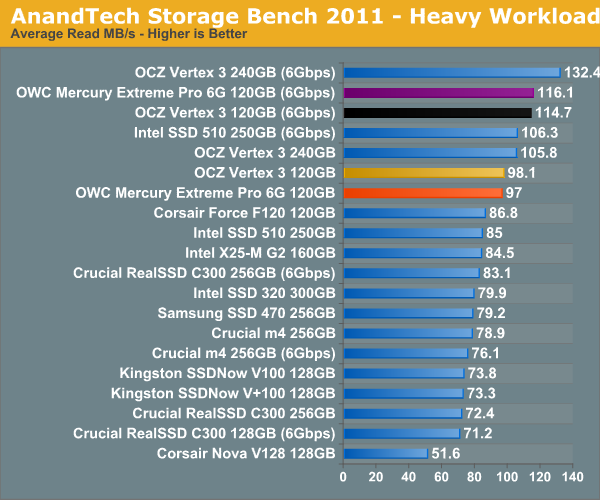
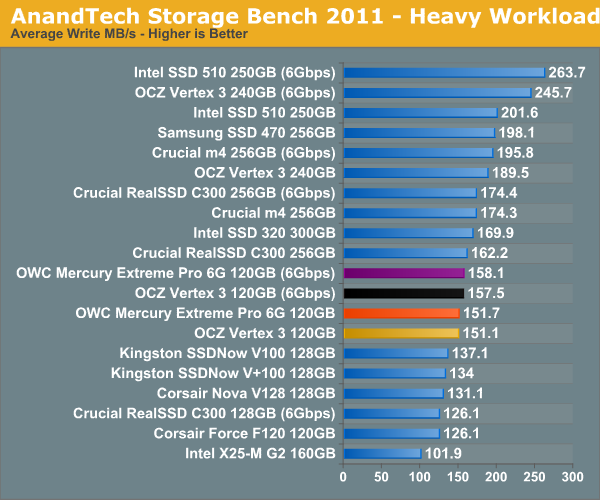
The breakdown of reads vs. writes tells us more of what's going on:
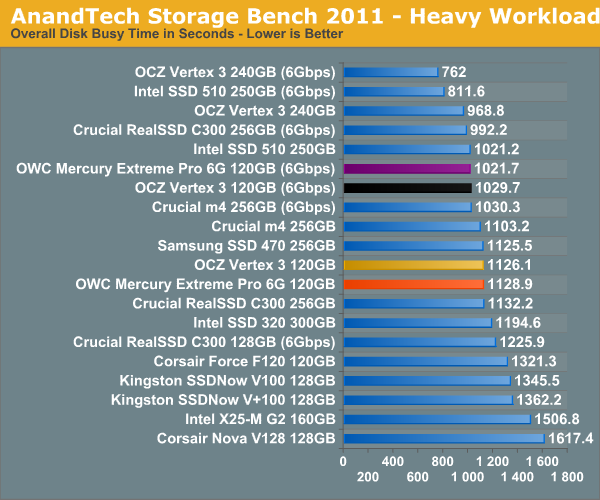
The next three charts just represent the same data, but in a different manner. Instead of looking at average data rate, we're looking at how long the disk was busy for during this entire test. Note that disk busy time excludes any and all idles, this is just how long the SSD was busy doing something:


44 Comments
View All Comments
altermaan - Thursday, May 5, 2011 - link
nice review though I'll most likely buy either the vertex 3 120GB max iops or the crucial m4 128GB. speaking of which: are there any plans of reviewing those two drives in the near future? I (and I think I'm might not be the only one) am desperately waiting for this as I don't wanna spend $300 for the wrong drive.greets
A
Nicolas Pillot - Thursday, May 5, 2011 - link
I see from the graphs, that- sequential read are faster than sequencial write, which seems ok
- random write are faster than random read, which seems illogical
That's the case for each and every ssd drive (well as far as i have checked)
Could somebody please explain this to me ?
Nihility - Thursday, May 5, 2011 - link
I'm not promising that this is the 100% correct reason, however it's possible that the random writes are being made to the cache (SSD's RAM) so that's quicker. While the reads have to be made from the actual flash storage.andymcca - Thursday, May 5, 2011 - link
Caching is another possible explanation, but if you run a test for any length of time (and I'm guessing the reviewers here do) logic dictates that your buffer will fill up if input rate > output rate.7Enigma - Thursday, May 5, 2011 - link
Makes sense to me. Writing to the drive only requires knowing where to put the data (ie is this block of space free or not). It's basically a limitation of how fast the cpu can deliver write requests to the SSD (so only 2 variables essentially).Random read on the other hand has an added variable of first FINDING the data on the SSD after the read request is made by the CPU. The latency of finding that data (as compared to writing in a free block) is where the performance difference occurs. This is why mechanical drives are so much slower than SSD's, but there still is an overhead on the "finding" part.
andymcca - Thursday, May 5, 2011 - link
Writes on SSDs are to wherever the drive wants to put them (not to a pre-defined physical location). Reads have to come from a pre-defined location, since that is where the data was already put. Basically, SSDs have to hunt for your read data, but put your write data somewhere convenient.JasonInofuentes - Thursday, May 5, 2011 - link
Could the power differences be a result of binning? Could be part of the perk of being Sandforce's favorite client.Thanks.
Jason
andymcca - Thursday, May 5, 2011 - link
My guess is that it has to do more with the memory and less with the controller, but IANAexpertaraczynski - Thursday, May 5, 2011 - link
I don't mean this as a stupid question (apologies if it is) but why not include a traditional platter driver in the ATStorageBench2011? Sometimes comparing apples to apples doesn't have the impact as when you also throw in an orange into the mix to help visualize what you're seeing.average MB/s of 100-200 on a certain bench doesn't mean much to me personally when i don't know how it compares to a traditional drive.
MilwaukeeMike - Thursday, May 5, 2011 - link
I agree. I like the Velociraptor included on some graphs because I own one, and know what the comparison is. These charts help us realize which SSD might suit our purposes best, but the question many of us are really wondering is 'should I upgrade to one at all?'The easy answer is 'yes', but having MS Word open in 1 second instead of 2 doesn't matter to me. Having my games load in 5 seconds instead of 25 does. But without an old school drive on the benchmark table we can't quantify SSD to HDD.
Review is great for SSD to SSD, don't get me wrong :)