OWC Mercury Extreme Pro 6G SSD Review (120GB)
by Anand Lal Shimpi on May 5, 2011 1:45 AM ESTRandom Read/Write Speed
The four corners of SSD performance are as follows: random read, random write, sequential read and sequential write speed. Random accesses are generally small in size, while sequential accesses tend to be larger and thus we have the four Iometer tests we use in all of our reviews.
Our first test writes 4KB in a completely random pattern over an 8GB space of the drive to simulate the sort of random access that you'd see on an OS drive (even this is more stressful than a normal desktop user would see). I perform three concurrent IOs and run the test for 3 minutes. The results reported are in average MB/s over the entire time. We use both standard pseudo randomly generated data for each write as well as fully random data to show you both the maximum and minimum performance offered by SandForce based drives in these tests. The average performance of SF drives will likely be somewhere in between the two values for each drive you see in the graphs. For an understanding of why this matters, read our original SandForce article.
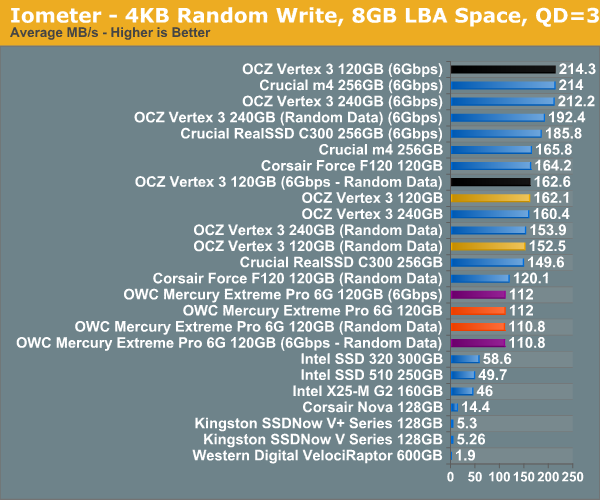
Here you can see the cap on 4KB random writes alive and well. As I've mentioned in previous articles, we're finally good enough when it comes to 4KB random write performance for current desktop workloads - so despite the cap you won't see any real world impact of it in our tests.
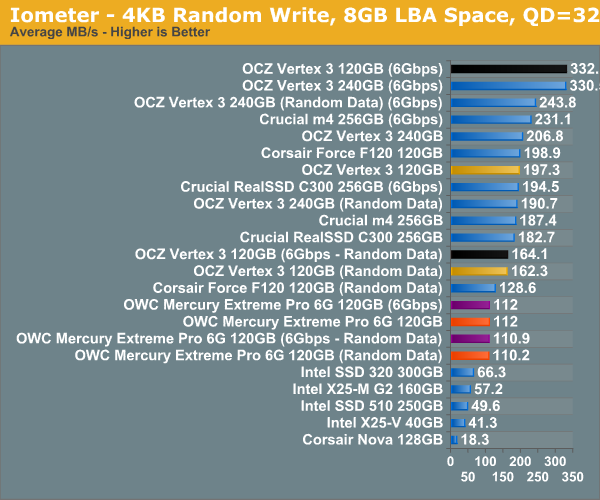
Many of you have asked for random write performance at higher queue depths. What I have below is our 4KB random write test performed at a queue depth of 32 instead of 3. While the vast majority of desktop usage models experience queue depths of 0 - 5, higher depths are possible in heavy I/O (and multi-user) workloads:
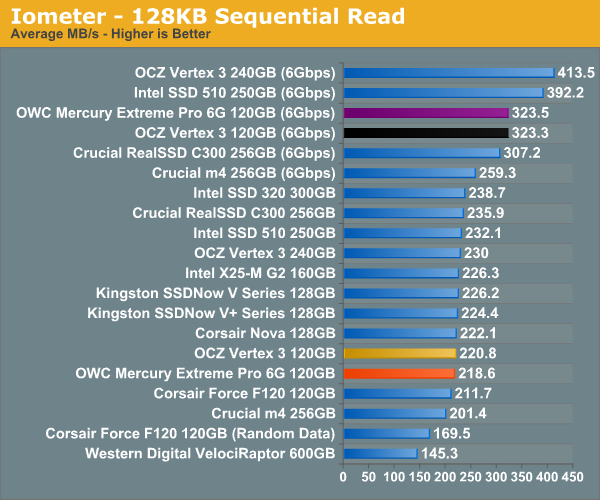
Sequential Read/Write Speed
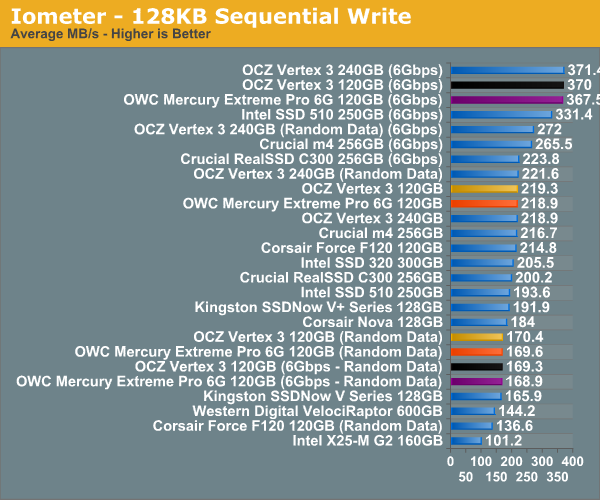
To measure sequential performance I ran a 1 minute long 128KB sequential test over the entire span of the drive at a queue depth of 1. The results reported are in average MB/s over the entire test length.


44 Comments
View All Comments
altermaan - Thursday, May 5, 2011 - link
nice review though I'll most likely buy either the vertex 3 120GB max iops or the crucial m4 128GB. speaking of which: are there any plans of reviewing those two drives in the near future? I (and I think I'm might not be the only one) am desperately waiting for this as I don't wanna spend $300 for the wrong drive.greets
A
Nicolas Pillot - Thursday, May 5, 2011 - link
I see from the graphs, that- sequential read are faster than sequencial write, which seems ok
- random write are faster than random read, which seems illogical
That's the case for each and every ssd drive (well as far as i have checked)
Could somebody please explain this to me ?
Nihility - Thursday, May 5, 2011 - link
I'm not promising that this is the 100% correct reason, however it's possible that the random writes are being made to the cache (SSD's RAM) so that's quicker. While the reads have to be made from the actual flash storage.andymcca - Thursday, May 5, 2011 - link
Caching is another possible explanation, but if you run a test for any length of time (and I'm guessing the reviewers here do) logic dictates that your buffer will fill up if input rate > output rate.7Enigma - Thursday, May 5, 2011 - link
Makes sense to me. Writing to the drive only requires knowing where to put the data (ie is this block of space free or not). It's basically a limitation of how fast the cpu can deliver write requests to the SSD (so only 2 variables essentially).Random read on the other hand has an added variable of first FINDING the data on the SSD after the read request is made by the CPU. The latency of finding that data (as compared to writing in a free block) is where the performance difference occurs. This is why mechanical drives are so much slower than SSD's, but there still is an overhead on the "finding" part.
andymcca - Thursday, May 5, 2011 - link
Writes on SSDs are to wherever the drive wants to put them (not to a pre-defined physical location). Reads have to come from a pre-defined location, since that is where the data was already put. Basically, SSDs have to hunt for your read data, but put your write data somewhere convenient.JasonInofuentes - Thursday, May 5, 2011 - link
Could the power differences be a result of binning? Could be part of the perk of being Sandforce's favorite client.Thanks.
Jason
andymcca - Thursday, May 5, 2011 - link
My guess is that it has to do more with the memory and less with the controller, but IANAexpertaraczynski - Thursday, May 5, 2011 - link
I don't mean this as a stupid question (apologies if it is) but why not include a traditional platter driver in the ATStorageBench2011? Sometimes comparing apples to apples doesn't have the impact as when you also throw in an orange into the mix to help visualize what you're seeing.average MB/s of 100-200 on a certain bench doesn't mean much to me personally when i don't know how it compares to a traditional drive.
MilwaukeeMike - Thursday, May 5, 2011 - link
I agree. I like the Velociraptor included on some graphs because I own one, and know what the comparison is. These charts help us realize which SSD might suit our purposes best, but the question many of us are really wondering is 'should I upgrade to one at all?'The easy answer is 'yes', but having MS Word open in 1 second instead of 2 doesn't matter to me. Having my games load in 5 seconds instead of 25 does. But without an old school drive on the benchmark table we can't quantify SSD to HDD.
Review is great for SSD to SSD, don't get me wrong :)