The OCZ Vertex 3 Review (120GB)
by Anand Lal Shimpi on April 6, 2011 6:32 PM ESTAnandTech Storage Bench 2011
I didn't expect to have to debut this so soon, but I've been working on updated benchmarks for 2011. Last year we introduced our AnandTech Storage Bench, a suite of benchmarks that took traces of real OS/application usage and played them back in a repeatable manner. I assembled the traces myself out of frustration with the majority of what we have today in terms of SSD benchmarks.
Although the AnandTech Storage Bench tests did a good job of characterizing SSD performance, they weren't stressful enough. All of the tests performed less than 10GB of reads/writes and typically involved only 4GB of writes specifically. That's not even enough exceed the spare area on most SSDs. Most canned SSD benchmarks don't even come close to writing a single gigabyte of data, but that doesn't mean that simply writing 4GB is acceptable.
Originally I kept the benchmarks short enough that they wouldn't be a burden to run (~30 minutes) but long enough that they were representative of what a power user might do with their system.
Not too long ago I tweeted that I had created what I referred to as the Mother of All SSD Benchmarks (MOASB). Rather than only writing 4GB of data to the drive, this benchmark writes 106.32GB. It's the load you'd put on a drive after nearly two weeks of constant usage. And it takes a *long* time to run.
I'll be sharing the full details of the benchmark in some upcoming SSD articles but here are some details:
1) The MOASB, officially called AnandTech Storage Bench 2011 - Heavy Workload, mainly focuses on the times when your I/O activity is the highest. There is a lot of downloading and application installing that happens during the course of this test. My thinking was that it's during application installs, file copies, downloading and multitasking with all of this that you can really notice performance differences between drives.
2) I tried to cover as many bases as possible with the software I incorporated into this test. There's a lot of photo editing in Photoshop, HTML editing in Dreamweaver, web browsing, game playing/level loading (Starcraft II & WoW are both a part of the test) as well as general use stuff (application installing, virus scanning). I included a large amount of email downloading, document creation and editing as well. To top it all off I even use Visual Studio 2008 to build Chromium during the test.
Update: As promised, some more details about our Heavy Workload for 2011.
The test has 2,168,893 read operations and 1,783,447 write operations. The IO breakdown is as follows:
| AnandTech Storage Bench 2011 - Heavy Workload IO Breakdown | ||||
| IO Size | % of Total | |||
| 4KB | 28% | |||
| 16KB | 10% | |||
| 32KB | 10% | |||
| 64KB | 4% | |||
Only 42% of all operations are sequential, the rest range from pseudo to fully random (with most falling in the pseudo-random category). Average queue depth is 4.625 IOs, with 59% of operations taking place in an IO queue of 1.
Many of you have asked for a better way to really characterize performance. Simply looking at IOPS doesn't really say much. As a result I'm going to be presenting Storage Bench 2011 data in a slightly different way. We'll have performance represented as Average MB/s, with higher numbers being better. At the same time I'll be reporting how long the SSD was busy while running this test. These disk busy graphs will show you exactly how much time was shaved off by using a faster drive vs. a slower one during the course of this test. Finally, I will also break out performance into reads, writes and combined. The reason I do this is to help balance out the fact that this test is unusually write intensive, which can often hide the benefits of a drive with good read performance.
There's also a new light workload for 2011. This is a far more reasonable, typical every day use case benchmark. Lots of web browsing, photo editing (but with a greater focus on photo consumption), video playback as well as some application installs and gaming. This test isn't nearly as write intensive as the MOASB but it's still multiple times more write intensive than what we were running last year.
As always I don't believe that these two benchmarks alone are enough to characterize the performance of a drive, but hopefully along with the rest of our tests they will help provide a better idea.
The testbed for Storage Bench 2011 has changed as well. We're now using a Sandy Bridge platform with full 6Gbps support for these tests. All of the older tests are still run on our X58 platform.
AnandTech Storage Bench 2011 - Heavy Workload
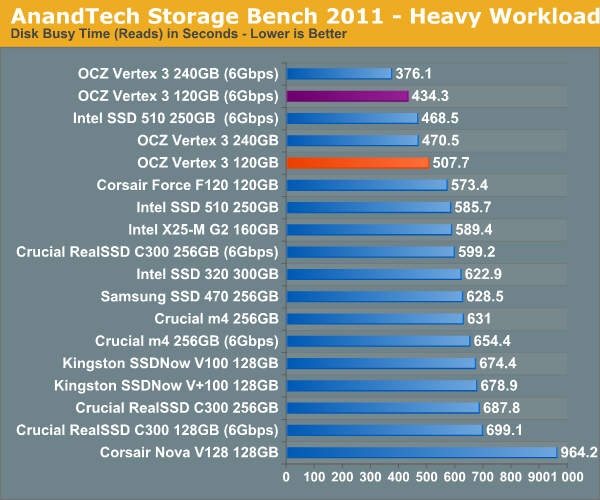
We'll start out by looking at average data rate throughout our new heavy workload test:
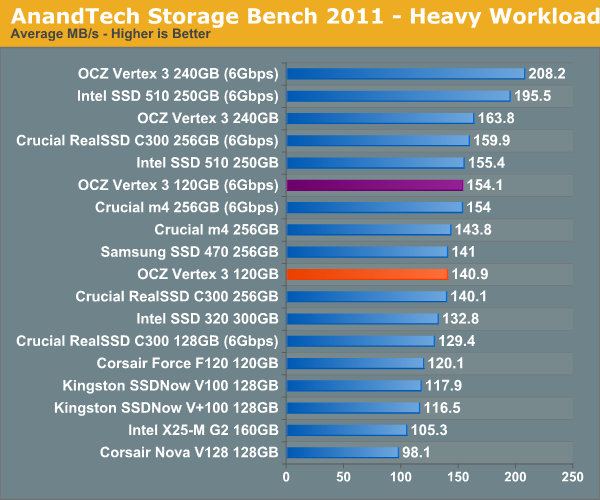
In our heavy test for 2011 the 120GB Vertex 3 is noticeably slower than the 240GB sample we tested a couple of months ago. Fewer available die are the primary explanation. We're still waiting on samples of the 120GB Intel SSD 320 and the Crucial m4 but it's looking like this round will be more competitive than we originally thought.
The breakdown of reads vs. writes tells us more of what's going on:
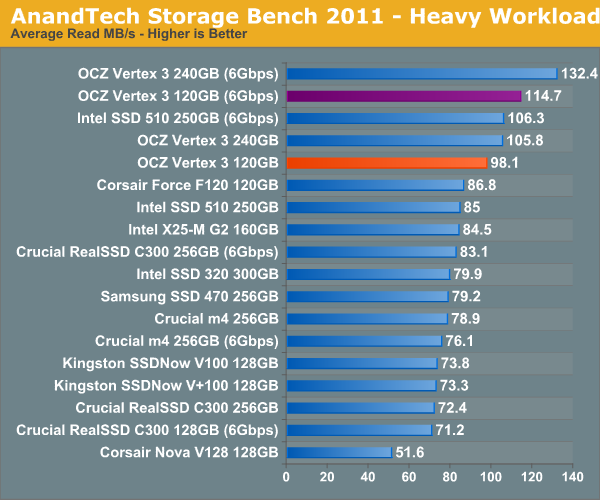
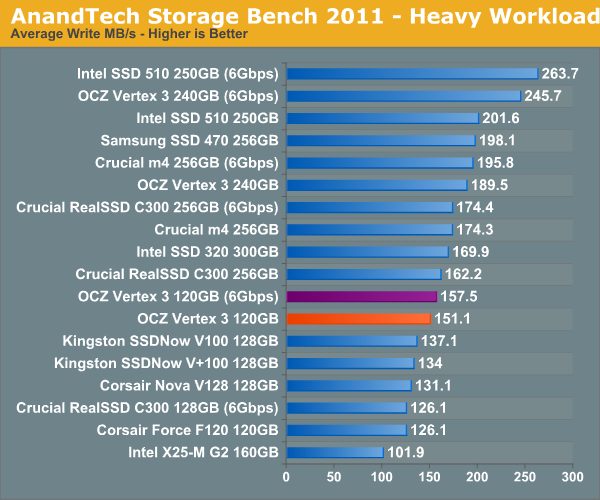
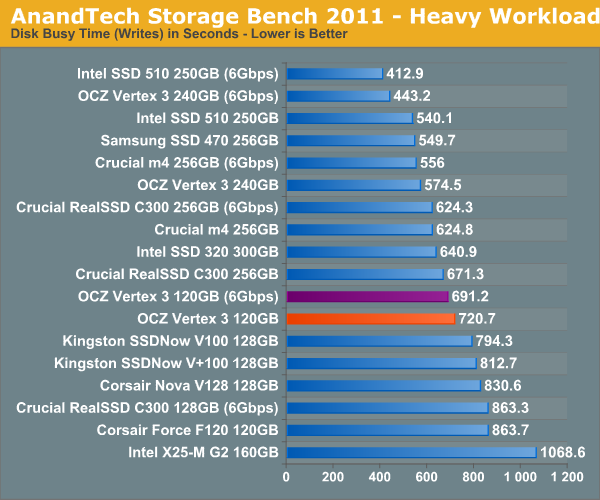
Surprisingly enough it's not read speed that holds the 120GB Vertex 3 back, it's ultimately the lower (incompressible) write speed:
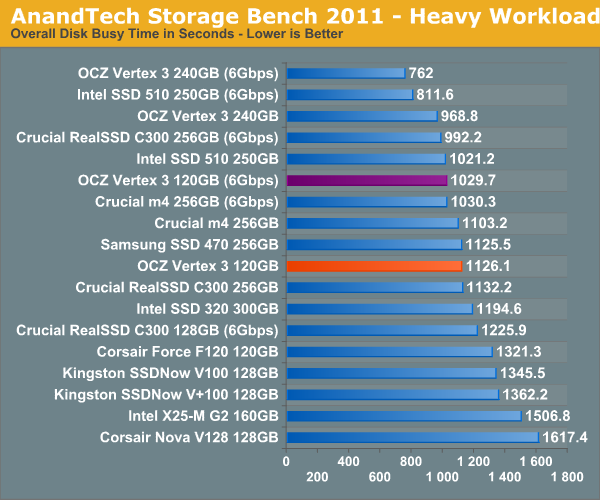
The next three charts just represent the same data, but in a different manner. Instead of looking at average data rate, we're looking at how long the disk was busy for during this entire test. Note that disk busy time excludes any and all idles, this is just how long the SSD was busy doing something:


153 Comments
View All Comments
soltys - Thursday, April 14, 2011 - link
Looking at past few articles, I was wondering - what exactly do SSDs do, that random writes are significantly faster than random reads (and looking at the tables above, 2x - 3x faster) ?Even considering magic firmware + spare space + caching - sooner or later R-E-M-W will have to be performed. And random patterns, with random data should emphasize that.
Any insights or pointers ?
Norrin - Friday, April 15, 2011 - link
Hi Anand,I have the vertex 3 installed in a 2011 macbook pro.
I'm having a horrible problem where the OS locks up for about 10 seconds every 30 minutes or so.
What was the problem that cause OCZ to delay their March 3rd launch day??
What changes were made (firmware version numbers)? How can the firmware on a vertex 3 be checked and where can the latest version be downloaded and installed?
I suspect the problem I'm seeing is the same which delayed their launch. Maybe they have a firmware update available now which can be installed in the disk I currently have....
Thanks so much!
jammmet - Tuesday, April 19, 2011 - link
I am experiencing exactly the same issue - did you find a workaround? Also, do you also have a spinning HD in your machine too?typofonic - Monday, April 18, 2011 - link
Wouldn't a Vertex 3 120 GB be a really bad choice for a boot drive when it has such a low random read performance, compared to the older Force F120/Vertex, even if I have a new SATA3 MacBook Pro?I can imagine that launching applications, booting the system etc. would be much slower with this compared to a Vertex 2/Corsair Force F120. Yes, the sequential performance is much better, but wouldn't the older drives seem snappier in normal everyday use?
Even if the Vertex 3 120GB cost the same as a Vertex 2/Force F120, wouldn't the older drives still be a much better choice for normal use, because of their high random read/write? Can't decide if I should go for the Vertex 3 or the Force F120/Vertex 2.
Anybody who knows more about this?
rgbxyz - Wednesday, April 20, 2011 - link
I own a 120 GB Vertex. I've been thinking about adding another one. However, it will not be an OCZ. With the word coming, that it seems. and I stress, seems, that OCZ can not once again be trusted. And this time around it's an even bigger issue.From the just released report: "OCZ has parlayed investor and market excitement for solid state drives (SSDs) into an amazing story. From a low of $1.79 last summer, OCZ's stock has steadily climbed more than 350% on a feel good tale told by its CEO. But there is a much darker and sinister side that has been well hidden. It is our opinion that OCZ has misrepresented its SSD growth and has financial irregularities that are nearly impossible to reconcile. We believe that some form of a restatement may be required and that the auditors tick and tie review has some substantial inconsistencies. As such, we have sent our findings to the Securities and Exchange Commission asking for clarification on the multiple sets of numbers that we have uncovered. We believe OCZ's Board has the fiduciary responsibility to form a special committee to examine these discrepancies." The bottom line for those curious where this short-seller sees the stock: "If OCZ trades in-line with the comp group, a generous assumption given OCZ's limited asset value, differentiation, and minimal profitability, a reasonable price target would be between $2.58 and $4.98 per share."
http://www.scribd.com/doc/53435574/OCZ-The-Master-...
la taupe - Friday, April 22, 2011 - link
http://www.scribd.com/doc/53435574/OCZ-The-Master-...geroj - Saturday, April 23, 2011 - link
it would be interesting to see if 2 120gb ssd-s in raid0 would be better choice over a 240gb vertex3 or intel 510 (performance and costwise).im thinking of putting 2x120gb crucial c300 in raid0, it would cost 2/3rd of a 240gb vertex3 but a thorough test would be nice before deciding.
2x64gb in raid0 is also enough for me (and as i see for a lot of us) but what about the performance?
ekerazha - Wednesday, April 27, 2011 - link
New "Vertex 3 Max IOPS" series released.120 GB
Read IOPS: 20.000 -> 35.000
Write IOPS: 60.000 -> 75.000
240 GB
Read IOPS: 40.000 -> 55.000
Write IOPS: 60.000 -> 65.000
Max Write: 520 MB/s -> 500 MB/s (decrease)
sor - Friday, April 29, 2011 - link
Yeah, what the hell is this all about? Anand mentioned in his review that there was supposed to be some sort of firmware cap on iops according to sandforce, but that his test vertex3 didn't have it, and that OCZ promised that performance of the shipping drive would be identical. Turns out apparently that they had TWO versions they were going to ship, and everyone was apparently led to believe that the test review one was the same performer that everyone has been jumping on as fast as they can ship. I think we've been duped.spensar - Saturday, April 30, 2011 - link
Love the real world benchmarks, and would like to see the Vertex 2 120gb numbers put up in the comparisions as well.