Apple iPad 2 GPU Performance Explored: PowerVR SGX543MP2 Benchmarked
by Anand Lal Shimpi on March 12, 2011 3:04 PM EST- Posted in
- Smartphones
- Apple
- iPad
- GLBenchmark
- iPad 2
- Mobile
- Tablets
Earlier this morning we published our first impressions on Apple's iPad 2, including analysis on camera quality and a dive into the architecture behind Apple's A5 SoC. Our SoC investigation mostly focused on CPU performance, which we found to be a healthy 50% faster than the A4 in the original iPad - at least in web browsing. We were able to exceed Apple's claim of up to 2x performance increase in some synthetic tests, but even a 50% increase in javascript and web page loading performance isn't anything to be upset about. We briefly touched on the GPU: Imagination Technologies' PowerVR SGX 543MP2. Here Apple is promising up to a 9x increase in performance, but it's something we wanted to investigate.

Architecturally the 543MP2 has more than twice the compute horsepower of the SGX 535 used in Apple's A4. Each shader pipeline can execute twice the number of instructions per clock as the SGX 535, and then there are four times as many pipes in an SGX 543MP2 as there are in a 535. There are also efficiency improvements as well. Hidden surface removal works at twice the rate in the 543MP2 as it did in the 535. There's also a big boost in texture filtering performance as you'll see below.
As always we turn to GLBenchmark 2.0, a benchmark crafted by a bunch of developers who either have or had experience doing development work for some of the big dev houses in the industry. We'll start with some of the synthetics.
Over the course of PC gaming evolution we noticed a significant increase in geometry complexity. We'll likely see a similar evolution with games in the ultra mobile space, and as a result this next round of ultra mobile GPUs will seriously ramp up geometry performance.
Here we look at two different geometry tests amounting to the (almost) best and worst case triangle throughput measured by GLBenchmark 2.0. First we have the best case scenario - a textured triangle:
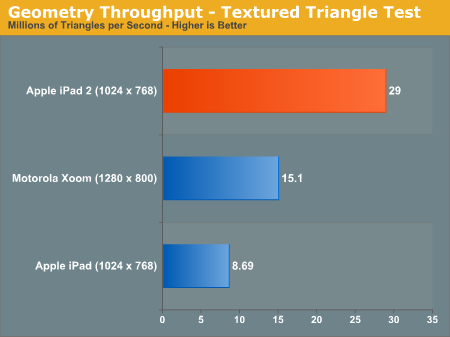
The original iPad could manage 8.7 million triangles per second in this test. The iPad 2? 29 million. An increase of over 3x. Developers with existing titles on the iPad could conceivably triple geometry complexity with no impact on performance on the iPad 2.
Now for the more complex case - a fragment lit triangle test:
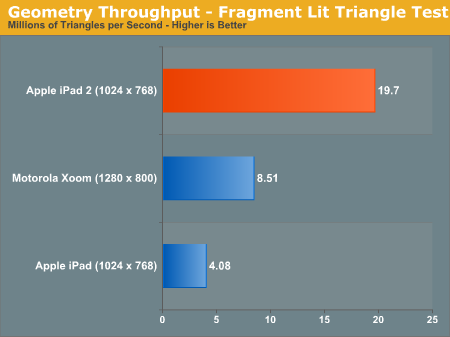
The performance gap widens. While the PowerVR SGX 535 in the A4 could barely break 4 million triangles per second in this test, the PowerVR SGX 543MP2 in the A5 manages just under 20 million. There's just no competition here.
I mentioned an improvement in texturing performance earlier. The GLBenchmark texture fetch test puts numbers to that statement:
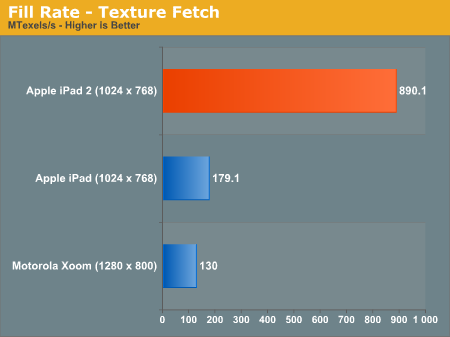
We're talking about nearly a 5x increase in texture fetch performance. This has to be due to more than an increase in the amount of texturing hardware. An improvement in throughput? Increase in memory bandwidth? It's tough to say without knowing more at this point.
| Apple iPad vs. iPad 2 | ||||
| Apple iPad (PowerVR SGX 535) | Apple iPad 2 (PowerVR SGX 543MP2) | |||
| Array test - uniform array access |
3412.4 kVertex/s
|
3864.0 kVertex/s
|
||
| Branching test - balanced |
2002.2 kShaders/s
|
11412.4 kShaders/s
|
||
| Branching test - fragment weighted |
5784.3 kFragments/s
|
22402.6kFragments/s
|
||
| Branching test - vertex weighted |
3905.9 kVertex/s
|
3870.6 kVertex/s
|
||
| Common test - balanced |
1025.3 kShaders/s
|
4092.5 kShaders/s
|
||
| Common test - fragment weighted |
1603.7 kFragments/s
|
3708.2 kFragments/s
|
||
| Common test - vertex weighted |
1516.6 kVertex/s
|
3714.0 kVertex/s
|
||
| Geometric test - balanced |
1276.2 kShaders/s
|
6238.4 kShaders/s
|
||
| Geometric test - fragment weighted |
2000.6 kFragments/s
|
6382.0 kFragments/s
|
||
| Geometric test - vertex weighted |
1921.5 kVertex/s
|
3780.9 kVertex/s
|
||
| Exponential test - balanced |
2013.2 kShaders/s
|
11758.0 kShaders/s
|
||
| Exponential test - fragment weighted |
3632.3 kFragments/s
|
11151.8 kFragments/s
|
||
| Exponential test - vertex weighted |
3118.1 kVertex/s
|
3634.1 kVertex/s
|
||
| Fill test - texture fetch |
179116.2 kTexels/s
|
890077.6 kTexels/s
|
||
| For loop test - balanced |
1295.1 kShaders/s
|
3719.1 kShaders/s
|
||
| For loop test - fragment weighted |
1777.3 kFragments/s
|
6182.8 kFragments/s
|
||
| For loop test - vertex weighted |
1418.3 kVertex/s
|
3813.5 kVertex/s
|
||
| Triangle test - textured |
8691.5 kTriangles/s
|
29019.9 kTriangles/s
|
||
| Triangle test - textured, fragment lit |
4084.9 kTriangles/s
|
19695.8 kTriangles/s
|
||
| Triangle test - textured, vertex lit |
6912.4 kTriangles/s
|
20907.1 kTriangles/s
|
||
| Triangle test - white |
9621.7 kTriangles/s
|
29771.1 kTriangles/s
|
||
| Trigonometric test - balanced |
1292.6 kShaders/s
|
3249.9 kShaders/s
|
||
| Trigonometric test - fragment weighted |
1103.9 kFragments/s
|
3502.5 kFragments/s
|
||
| Trigonometric test - vertex weighted |
1018.8 kVertex/s
|
3091.7 kVertex/s
|
||
| Swapbuffer Speed |
600
|
599
|
||
Enough with the synthetics - how much of an improvement does all of this yield in the actual GLBenchmark 2.0 game tests? Oh it's big.


219 Comments
View All Comments
EarthCore - Sunday, March 13, 2011 - link
How does the iPad beat a netbook when it comes to browsing when it can't display over 40% of the websites that use Java and Flash?As far as licensing media goes, netbooks can display all media a laptop can display.
iPad has restrictive media licensing policies. Try searching for a Vevo music video on the iPad. You will get ZERO results. Try the same search on a netbook on Youtube. See the difference? What koolaid are you drinking?
Real physical keyboard vs virtual keyboard, no need to explain this one. But if you really want to have a WPM typing contest on your precious iPad vs my netbook...then game on!
Lastly, I'd want to see some benchies between Intel Atom and the A5 before sheepishly saying that iPad trumps netbooks.
Jesus, the Apple fan boys have no capacity for independent thought do they?
kmmatney - Sunday, March 13, 2011 - link
For the average Joe, a tablet provides easier access to email, games and applications, and typically provides a much better web browsing experience. I don't see the point in a netbook, really - get a real notebook for real work, and use a tablet for leisure.solipsism - Sunday, March 13, 2011 - link
it’s Apple’s 3rd most profitable business segment and will likely be the 2nd most profitable sometime this year, only behind the iPhone. Apple make more profit than MS now and that is helped by additional iPad sales, not inspite of, like the loss leader “me to” products that come out each month claiming to be "<Apple product>-killers”.On top of that the iPad is the fasting selling CE and Apple made this market segment viable despite other vendors having a couple decades to figure it out. Sure, it all makes sense and seems obvious now that it was explained to you assuming Apple did nothing special here. Where was Moto, Nokia and RiM’s tablets? Where was MS’ WinMo tablet OS?
So why again do you think that that this market isn’t popular or profitable?
ncb1010 - Sunday, March 13, 2011 - link
"On top of that the iPad is the fasting selling CE"If CE = Consumer Electronic....
Kinect sold 10 million in 3 or 4 months. Quite a bit faster than iPad with 15 million in 9 months with about half in Q4.
solipsism - Monday, March 14, 2011 - link
It is sold to consumers and it does contain electronics, but it’s an accessory to a device so I don’t include that in any such listing. Do you include headphones and power adapters as CE? I surely don’t.wytworm - Monday, March 14, 2011 - link
...and yet the digitaltrends.com and the Guinness Book of World records does.http://www.digitaltrends.com/gaming/xbox-kinect-sa...
Spazweasel - Monday, March 14, 2011 - link
The "Guiness" in the "Guiness Book of World Records" is the beer company. Really.I don't think their opinion on anything other than beer is authoritative, accurate, educated, informed, or relevant. These are the same people that keep track of biggest burritos and largest tumors. Quoting them on matters of consumer electronics is like quoting the National Enquirer on... anything.
ncb1010 - Saturday, March 12, 2011 - link
27% to 73% is a 1:3 ratio...not 1:4.ncb1010 - Saturday, March 12, 2011 - link
And that is not including e-readers like the Amazon Kindle or Nook Color which I classify as a tablet. If you include that, Apple's market share dips to about 50% because of the 12 million e-readers sold in 2010.akedia - Saturday, March 12, 2011 - link
And that's not including MP3 players, smartphones, netbooks, laptops, desktops, or supercomputers, which I classify as tablets too!You're conflating two very different device categories to make the argument that a *mere* 50% market share for a single device isn't particularly significant? *slow claps* Quite the argument you make there. Quite the argument.