The Intel SSD 510 Review
by Anand Lal Shimpi on March 2, 2011 1:23 AM EST- Posted in
- IT Computing
- Storage
- SSDs
- Intel
- Intel SSD 510
Random Read/Write Speed
The four corners of SSD performance are as follows: random read, random write, sequential read and sequential write speed. Random accesses are generally small in size, while sequential accesses tend to be larger and thus we have the four Iometer tests we use in all of our reviews.
Our first test writes 4KB in a completely random pattern over an 8GB space of the drive to simulate the sort of random access that you'd see on an OS drive (even this is more stressful than a normal desktop user would see). I perform three concurrent IOs and run the test for 3 minutes. The results reported are in average MB/s over the entire time. We use both standard pseudo randomly generated data for each write as well as fully random data to show you both the maximum and minimum performance offered by SandForce based drives in these tests. The average performance of SF drives will likely be somewhere in between the two values for each drive you see in the graphs. For an understanding of why this matters, read our original SandForce article.
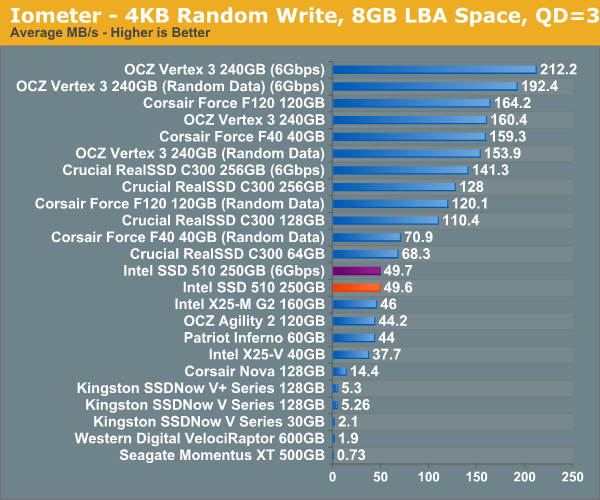
It's a bit unfortunate for Intel that we happen to start our performance analysis with a 4KB random write test in Iometer. The 510's random write performance is only marginally better than the X25-M G2 at 49.7MB/s. The RealSSD C300 is faster, not to mention the SF-1200 based Corsair Force F120 and the SF-2200 based OCZ Vertex 3.
Although not depicted here, max write latency is significantly reduced compared to the X25-M G2. While the G2 would occasionally hit a ~900ms write operation, the 510 keeps the worst case latency to below 400ms. The Vertex 3 by comparison has a max write latency of anywhere from 60ms - 350ms depending on the type of data being written.
Many of you have asked for random write performance at higher queue depths. What I have below is our 4KB random write test performed at a queue depth of 32 instead of 3. While the vast majority of desktop usage models experience queue depths of 0 - 5, higher depths are possible in heavy I/O (and multi-user) workloads:
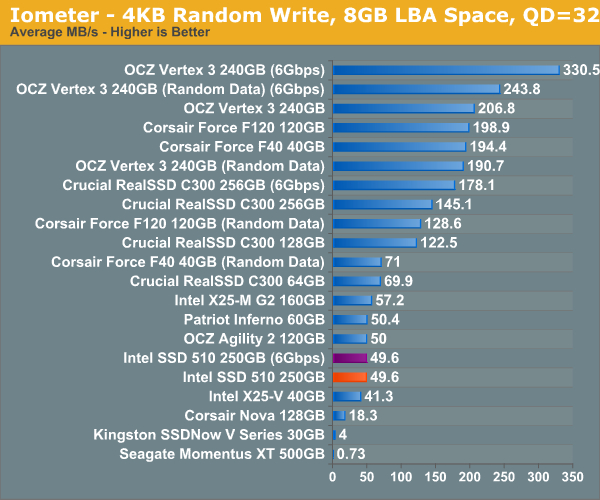
While the X25-M G2 scaled with queue depth in our random write test, the 510 does not. It looks like 50MB/s is the absolute highest performance we'll see for constrained 4KB random writes. Note that these numbers are for 4KB aligned transfers, performance actually drops down to ~40MB/s if you perform sector aligned transfers (e.g. performance under Windows XP).
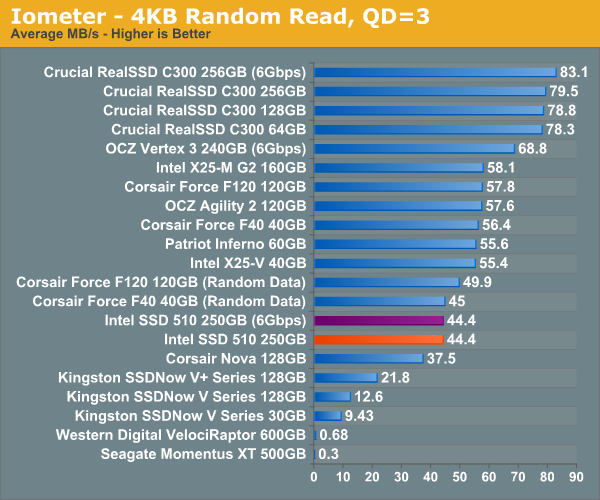
Random read performance is just as disappointing. The X25-M G2 took random read performance seriously but the 510 is less than 20% faster than the Indilinx based Corsair Nova. When I said the Intel SSD 510's random performance is decidedly last-generation, I meant it.


128 Comments
View All Comments
7Enigma - Wednesday, March 2, 2011 - link
Like Anand I'm shocked Intel went this route. After touting the random read/write so heavily (and for good reason) they pull this stunt and look horrible. I'm an owner of an 80gig G2 and love it but have been in the process of justifying an upgrade so I can put the 80gig in my laptop. I'm willing to sacrifice a bit of sequential performance (just like I did with the G2 over other competitors), but this is a complete step backwards.And remember the review unit was the larger drive. Put the 120gig version in those benchmarks and the critical numbers that are so low to start with are only going to become much worse. Just like all of the previous releases due to high cost the majority of people will be purchasing the smaller-sized drives (most people bought Intel 80gig when 160gig was out, etc.).
When you are competing on firmware only, and that firmware is not the best to begin with (in comparison to Sandforce), you have to be perfect, and in this case Intel just didn't produce.
Very disappointed indeed.
Concillian - Wednesday, March 2, 2011 - link
"After touting the random read/write so heavily (and for good reason) they pull this stunt and look horrible."They don't look horrible, they are 2nd or 1st in most of the real world tests, Improving on the G2 performance.
Random performance is lower, but the real world tests demonstrate that random performance has reached a point where it is "enough" for typical workloads.
semo - Wednesday, March 2, 2011 - link
Whose real world are we talking about here? Average Joe "real world", mainstream "real world", enthusiast "real world"... you get the idea.As an average user (net browsing, office apps, flash gaming, etc...) this sort of performance is great. However, the same user would benefit just as much from a much cheaper 60GB SSD. The 510 is neither cheap overall or in $/GB sense. My "real world" is using VMs and lot's of tests involving high QDs and IOPS so this drive is not for me... At that price, capacity and performance, I don't know who this drive is for.
TEAMSWITCHER - Wednesday, March 2, 2011 - link
It's a bit surprising that the Crucial C300 (on the 6 GB/s) interface did so well in the real world benchmarks. This drive is a year old and still competitive. Newegg had them on sale a couple weeks ago for only $480.00. Which is a bargain compared to the $615.00 for the Intel 510. This is an interesting technology to watch, with lots of plot twists and upsets. I can't wait to see the crucial M4.Lonesloane - Wednesday, March 2, 2011 - link
I see the price point of the new Intel 510 drives extremely critical. Intel have always charged more than the competition and got away with it due to the fact that on the other hand there was the good quality, compatibility and reliablity of their SSD products.Now it seems like a clear win for Sandforce, especially if we take the superior write amplification of the sandforce controller, which is a big advantage regarding the reduced write cycles of the new 25nm NAND.
Shadowmaster625 - Wednesday, March 2, 2011 - link
You have to tell them to stop sending you Ferraris because no one buys Ferraris. The 120GB versions of both the OCZ and Intel drives are much more relevant, and we dont have the foggiest clue how they line up. And even if we did, we would not know how the 40/60/80 GB versions stack up against each other. I am currently shopping for a 40-60GB SSD and I cannot even to this day get a clear answer on which product is better (performance per dollar). And all of these drives have been out for at least year....7Enigma - Wednesday, March 2, 2011 - link
Exactly. I posted above about this and it will seriously hurt Intel as the poor random read/write will only become worse.Concillian - Wednesday, March 2, 2011 - link
"I am currently shopping for a 40-60GB SSD and I cannot even to this day get a clear answer on which product is better (performance per dollar). And all of these drives have been out for at least year.... "This is a concern and all you really need to know is how they reduce capacity.
They can do it by reducing the number of chips (usually will see a performance hit)
or
They can do it by using the same number of chips, but each stores less (usually will perform about the same)
When you look at the OCZ 25nm "debacle" it was this very decision that created the issue. The 25nm flash itself was not the problem (even though that got a fair bit of the blame)... it was how they implemented it. They used half the 25nm higher density chips in the drives, reducing performance. This also meant reserving one block for over-provision meant it was larger in size, so that ate into the usable capacity. The solution still uses 25nm chips, but they're the same number of chips as 34nm, so they perform at about the same level.
There probably needs to be a chart at the beginning like the video card articles showing details for each drive. It would clear up any issues, as well as something that can be referred to in the future. I refer to the old video card reviews when looking for things like ROP / texture counts, memory bandwidth, speeds, etc... because those charts have really useful information in them.
jnmfox - Wednesday, March 2, 2011 - link
+1We need a round-up of OS boot drives (40/60/80 GB). I love my 80GB G2 but I’m not interested in paying more than $200, hopefully less, for an SSD.
Stargrazer - Wednesday, March 2, 2011 - link
I too would love to see the numbers for the 128(-ish) GB versions.