OCZ Vertex 3 Preview: Faster and Cheaper than the Vertex 3 Pro
by Anand Lal Shimpi on February 24, 2011 9:02 AM ESTAnandTech Storage Bench 2011: Much Heavier
I didn't expect to have to debut this so soon, but I've been working on updated benchmarks for 2011. Last year we introduced our AnandTech Storage Bench, a suite of benchmarks that took traces of real OS/application usage and played them back in a repeatable manner. I assembled the traces myself out of frustration with the majority of what we have today in terms of SSD benchmarks.
Although the AnandTech Storage Bench tests did a good job of characterizing SSD performance, they weren't stressful enough. All of the tests performed less than 10GB of reads/writes and typically involved only 4GB of writes specifically. That's not even enough exceed the spare area on most SSDs. Most canned SSD benchmarks don't even come close to writing a single gigabyte of data, but that doesn't mean that simply writing 4GB is acceptable.
Originally I kept the benchmarks short enough that they wouldn't be a burden to run (~30 minutes) but long enough that they were representative of what a power user might do with their system.
Not too long ago I tweeted that I had created what I referred to as the Mother of All SSD Benchmarks (MOASB). Rather than only writing 4GB of data to the drive, this benchmark writes 106.32GB. It's the load you'd put on a drive after nearly two weeks of constant usage. And it takes a *long* time to run.
I'll be sharing the full details of the benchmark in some upcoming SSD articles (again, I wasn't expecting to have to introduce this today so I'm a bit ill prepared) but here are some details:
1) The MOASB, officially called AnandTech Storage Bench 2011 - Heavy Workload, mainly focuses on the times when your I/O activity is the highest. There is a lot of downloading and application installing that happens during the course of this test. My thinking was that it's during application installs, file copies, downloading and multitasking with all of this that you can really notice performance differences between drives.
2) I tried to cover as many bases as possible with the software I incorporated into this test. There's a lot of photo editing in Photoshop, HTML editing in Dreamweaver, web browsing, game playing/level loading (Starcraft II & WoW are both a part of the test) as well as general use stuff (application installing, virus scanning). I included a large amount of email downloading, document creation and editing as well. To top it all off I even use Visual Studio 2008 to build Chromium during the test.
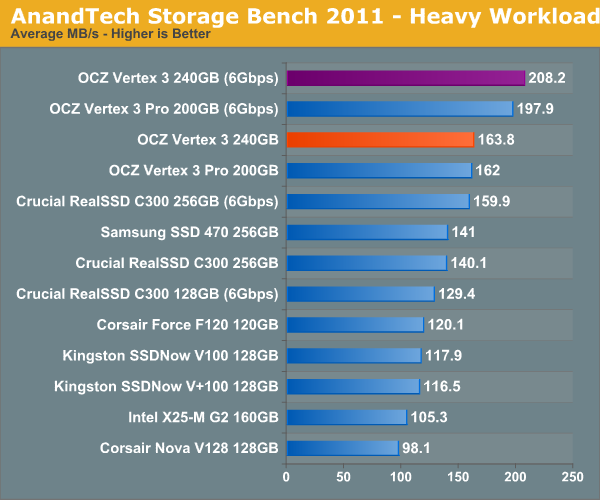
Many of you have asked for a better way to really characterize performance. Simply looking at IOPS doesn't really say much. As a result I'm going to be presenting Storage Bench 2011 data in a slightly different way. We'll have performance represented as Average MB/s, with higher numbers being better. At the same time I'll be reporting how long the SSD was busy while running this test. These disk busy graphs will show you exactly how much time was shaved off by using a faster drive vs. a slower one during the course of this test. Finally, I will also break out performance into reads, writes and combined. The reason I do this is to help balance out the fact that this test is unusually write intensive, which can often hide the benefits of a drive with good read performance.
There's also a new light workload for 2011. This is a far more reasonable, typical every day use case benchmark. Lots of web browsing, photo editing (but with a greater focus on photo consumption), video playback as well as some application installs and gaming. This test isn't nearly as write intensive as the MOASB but it's still multiple times more write intensive than what we were running last year.
As always I don't believe that these two benchmarks alone are enough to characterize the performance of a drive, but hopefully along with the rest of our tests they will help provide a better idea.
The testbed for Storage Bench 2011 has changed as well. We're now using a Sandy Bridge platform with full 6Gbps support for these tests. All of the older tests are still run on our X58 platform.
AnandTech Storage Bench 2011 - Heavy Workload
We'll start out by looking at average data rate throughout our new heavy workload test:
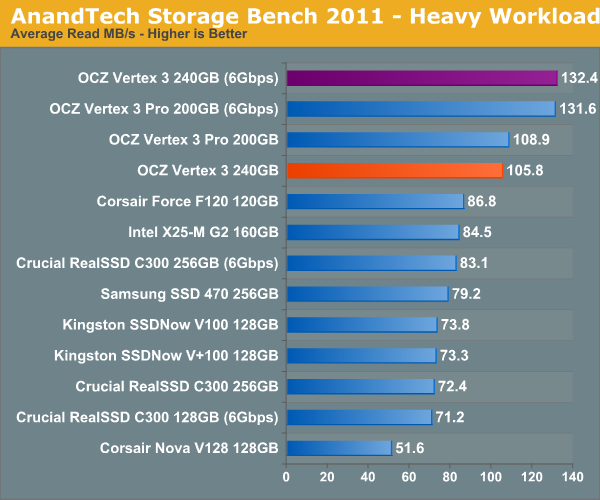
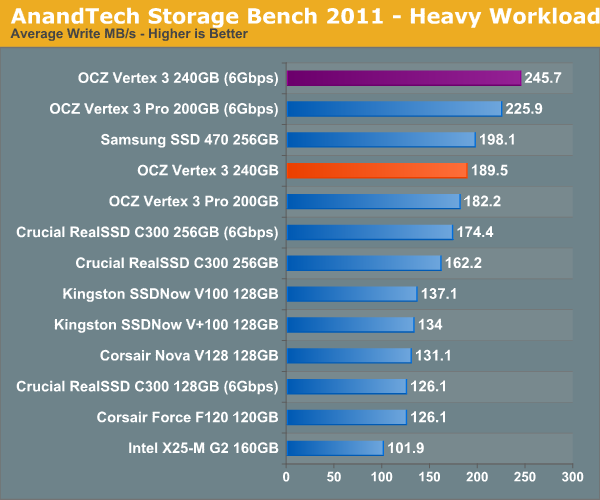
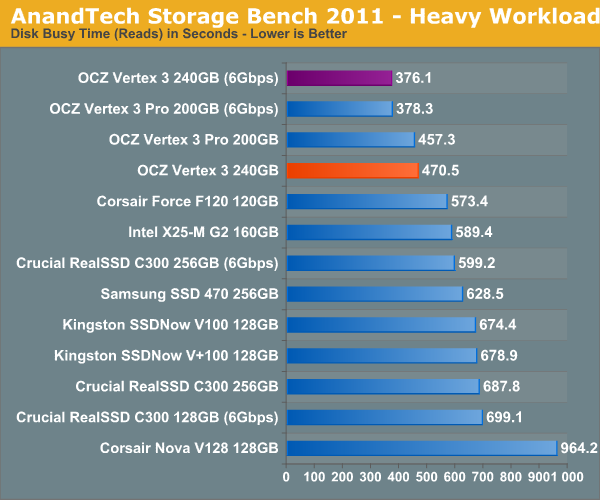
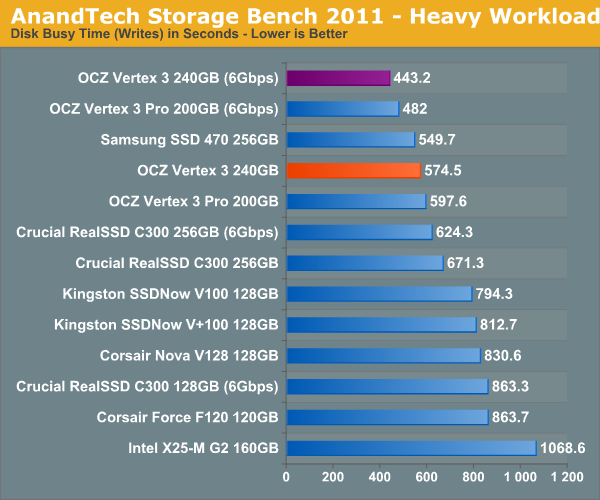
If we break out our performance results into average read and write speed we get a better idea for the Vertex 3's strengths:
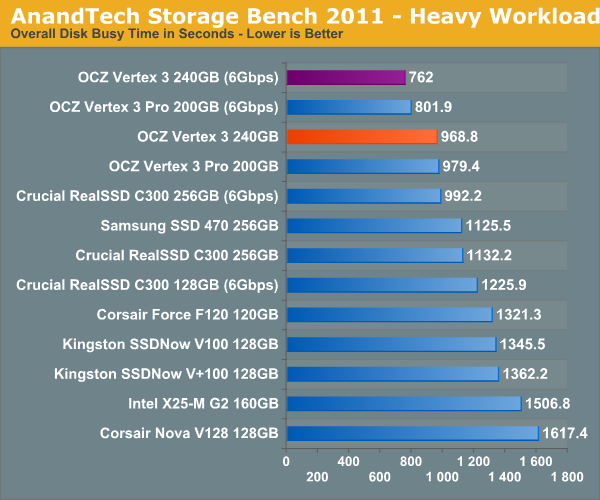
The next three charts just represent the same data, but in a different manner. Instead of looking at average data rate, we're looking at how long the disk was busy for during this entire test. Note that disk busy time excludes any and all idles, this is just how long the SSD was busy doing something:


85 Comments
View All Comments
ErikO - Wednesday, March 9, 2011 - link
It has been over two years, since I took the plunge for SSD, and on my third one, (Intel SLC), I'm loving it, as McDonalds marketing team would surely love everyone to say.I started with that woeful OCZ SSD, (that created more noise than the Mohammad Cartoons in the world).
They sent me a second one by some way of peace offering (I wrote them from the address of a small tech site I own), but public reviews said they were just as bad. Sold on Ebay with no reserve. (almost got my money back too)
Then a year ago, my wallet allowed for a 160GB X25-M. That was -worlds- better, but still every now and then (once an hour?) my music would skip - and I recognised that as MLC behaviour. This would be the high-latency small-file-size writes then. But as an audiophile, who does actually connect his computer to his hi-fi (via a dedicated sound card of course), this meant noticable breaks in a high output system. Not cool in front of guests.
So a couple of weeks back, I bought the 64GB X25-E. This was everything I had hoped for. This is what I expected SSDs would give us from day one. The size of the disk is painful though, but I digress.
My question is...with all these much higher results out there, am I really going to perceive much of a difference in system-wide performance? Intel seems to be dropping SLC as far as I can see, and based on my experience, I don't think I can / could turn my back on SLC technology again...!
So where is all the talk of the X25-E - of recent? They are for sale everywhere, but the internet seems almost dead to their existance. Too small? Too expensive?
Even if I can be convinced into a Vertex, I will definately have to pay the high admission cost for the pro...I'd happily sacrifice some speed for consistancy of performance.
Gents, let me know what you know?
Thanks.
SeattleGeek - Thursday, March 10, 2011 - link
Will the 128GB model perform the same as the 256GB model that is reviewed?Also, do they have the same number of channels?
sean.crees - Friday, March 11, 2011 - link
Where are the benchmarks for the Vertex 2? I'd really like to see how exactly the new Vertex 3 compares to the drive it's supposed to replace.Dssguy1 - Monday, April 18, 2011 - link
Because we know OCZ is infamous for trickery, I would like to know if you got some kind of "super juiced-up" version of the drive for review.It would make me feel a lot better about dropping $550 (basically because I just did), if I knew that the review SSD you tested, matches what we are getting when we buy the Retail version.
davele - Friday, December 30, 2011 - link
Based on what you describe I wonder if this testing is really a representative snapshot of any common use pattern.ie: Application installs - typically this is a once off activity. Any one machine only installs a finite number of applications. (the exception being a SCOM based virtual desktop where the entire systems is installed each time a user logs on. But that is Enterprise & they are very unlikely to put SSD's in user workstations)
For Enterprise SSD benchmarks please consider profiling a SQL Server system running both normal OLTP app & a Sharepoint app.
The OLTP would give you huge numbers of 4K & 64K random writes, while the logs would give you largely a sequential write. The Sharepoint app is a heavy BLOB store, So this would give you the a random set of large sequential I/O, with much more Read than Write.
The advantage of this is you can backup the database, capture the I/O requests. Then each test is just a restore & replay of the requests. Easy, repeatable & extremely representative of Heavy I/O workload. Especially an enterprise class load.