OCZ Vertex 3 Preview: Faster and Cheaper than the Vertex 3 Pro
by Anand Lal Shimpi on February 24, 2011 9:02 AM ESTAnandTech Storage Bench 2011: Much Heavier
I didn't expect to have to debut this so soon, but I've been working on updated benchmarks for 2011. Last year we introduced our AnandTech Storage Bench, a suite of benchmarks that took traces of real OS/application usage and played them back in a repeatable manner. I assembled the traces myself out of frustration with the majority of what we have today in terms of SSD benchmarks.
Although the AnandTech Storage Bench tests did a good job of characterizing SSD performance, they weren't stressful enough. All of the tests performed less than 10GB of reads/writes and typically involved only 4GB of writes specifically. That's not even enough exceed the spare area on most SSDs. Most canned SSD benchmarks don't even come close to writing a single gigabyte of data, but that doesn't mean that simply writing 4GB is acceptable.
Originally I kept the benchmarks short enough that they wouldn't be a burden to run (~30 minutes) but long enough that they were representative of what a power user might do with their system.
Not too long ago I tweeted that I had created what I referred to as the Mother of All SSD Benchmarks (MOASB). Rather than only writing 4GB of data to the drive, this benchmark writes 106.32GB. It's the load you'd put on a drive after nearly two weeks of constant usage. And it takes a *long* time to run.
I'll be sharing the full details of the benchmark in some upcoming SSD articles (again, I wasn't expecting to have to introduce this today so I'm a bit ill prepared) but here are some details:
1) The MOASB, officially called AnandTech Storage Bench 2011 - Heavy Workload, mainly focuses on the times when your I/O activity is the highest. There is a lot of downloading and application installing that happens during the course of this test. My thinking was that it's during application installs, file copies, downloading and multitasking with all of this that you can really notice performance differences between drives.
2) I tried to cover as many bases as possible with the software I incorporated into this test. There's a lot of photo editing in Photoshop, HTML editing in Dreamweaver, web browsing, game playing/level loading (Starcraft II & WoW are both a part of the test) as well as general use stuff (application installing, virus scanning). I included a large amount of email downloading, document creation and editing as well. To top it all off I even use Visual Studio 2008 to build Chromium during the test.
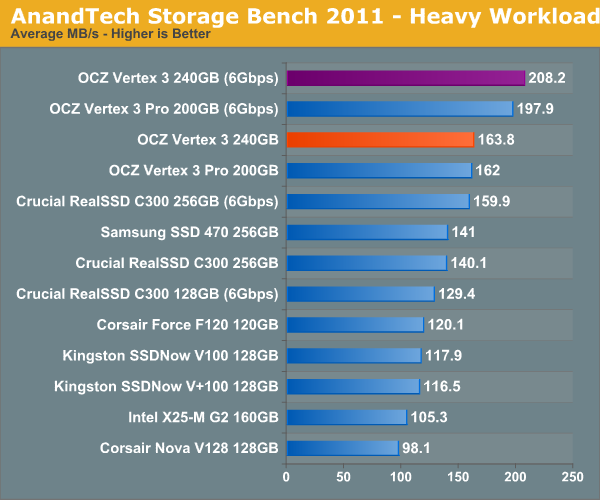
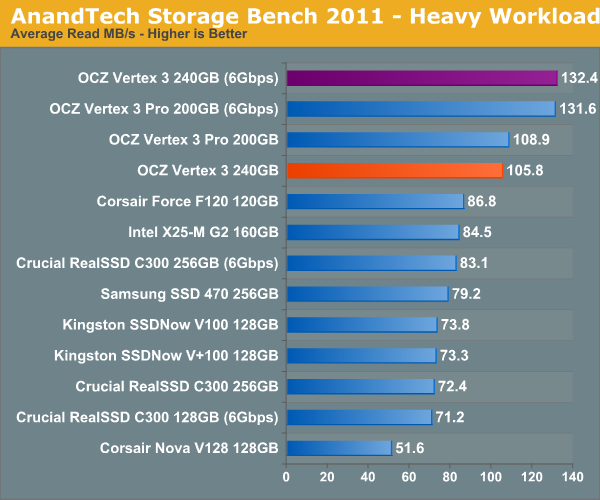
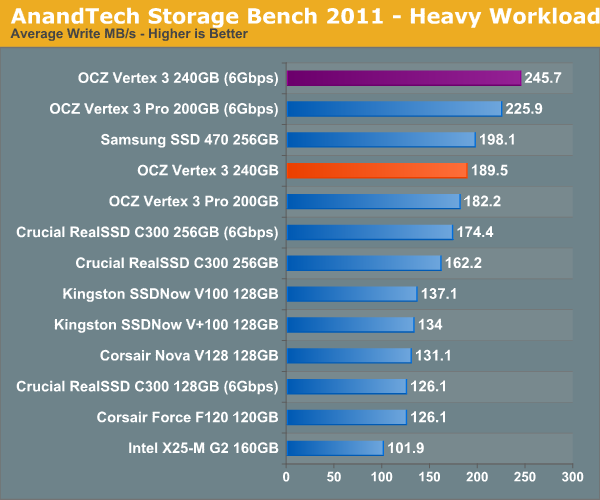
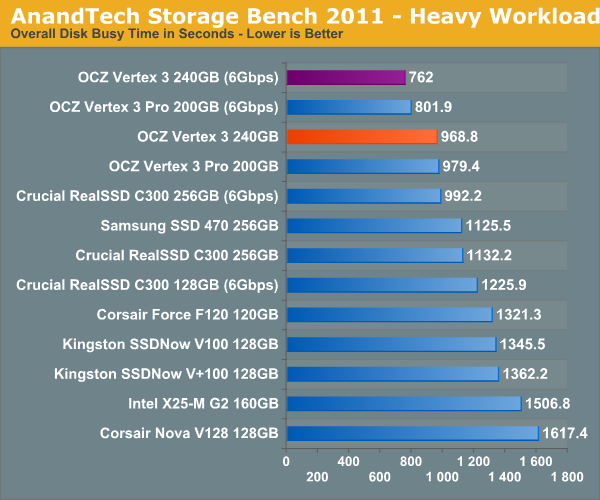
Many of you have asked for a better way to really characterize performance. Simply looking at IOPS doesn't really say much. As a result I'm going to be presenting Storage Bench 2011 data in a slightly different way. We'll have performance represented as Average MB/s, with higher numbers being better. At the same time I'll be reporting how long the SSD was busy while running this test. These disk busy graphs will show you exactly how much time was shaved off by using a faster drive vs. a slower one during the course of this test. Finally, I will also break out performance into reads, writes and combined. The reason I do this is to help balance out the fact that this test is unusually write intensive, which can often hide the benefits of a drive with good read performance.
There's also a new light workload for 2011. This is a far more reasonable, typical every day use case benchmark. Lots of web browsing, photo editing (but with a greater focus on photo consumption), video playback as well as some application installs and gaming. This test isn't nearly as write intensive as the MOASB but it's still multiple times more write intensive than what we were running last year.
As always I don't believe that these two benchmarks alone are enough to characterize the performance of a drive, but hopefully along with the rest of our tests they will help provide a better idea.
The testbed for Storage Bench 2011 has changed as well. We're now using a Sandy Bridge platform with full 6Gbps support for these tests. All of the older tests are still run on our X58 platform.
AnandTech Storage Bench 2011 - Heavy Workload
We'll start out by looking at average data rate throughout our new heavy workload test:
If we break out our performance results into average read and write speed we get a better idea for the Vertex 3's strengths:
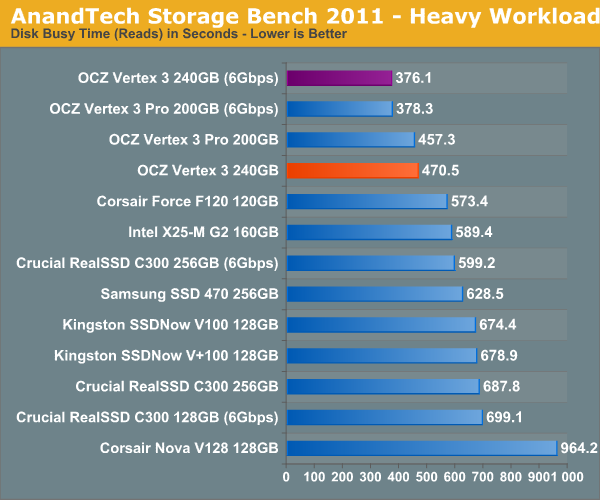
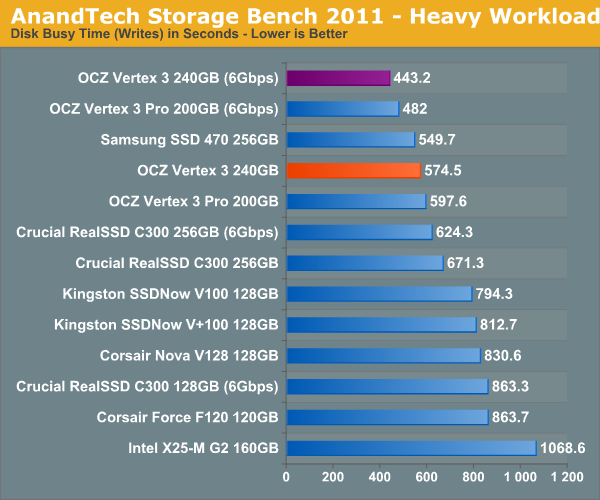
The next three charts just represent the same data, but in a different manner. Instead of looking at average data rate, we're looking at how long the disk was busy for during this entire test. Note that disk busy time excludes any and all idles, this is just how long the SSD was busy doing something:


85 Comments
View All Comments
FunBunny2 - Friday, February 25, 2011 - link
If you're running a really relational database, then random performance is what matters.iwod - Friday, February 25, 2011 - link
Yes, but 99% of Normal World Users dont run Relational DB. And those who ran the DB would properly search for faster Random I/O instead.jimhsu - Friday, February 25, 2011 - link
It ... depends. Real world performance is really complicated:1. You can have any combination of read or writes, sequential or random, going on at once.
2. You have both synchronous IO (this read must be done before that read) and asynchronous IO (this reads all need to be executed, but in whatever order).
3. You have other bottlenecks coming into play - CPU, memory, GPU, ...
All the basic metrics (seq read/write, random read/write) are important. As well as performance with mixed read/write workloads (this is in fact the most difficult aspect to bench). Hard drives have been around for decades, so we have well-established metrics for determining performance. Flash SSDs have been around for less than 10, and in the consumer market, less than 3 years.
iwod - Friday, February 25, 2011 - link
Yes Performance is Complicated. But it doesn't matter in this context. We are trying to find the bottleneck and fastest Storage Hardware within today's Applications. And the Anandtech Bechmarks, is basically just a batch script that execute common task that we do. Time and Average it as Scores.Time and Time again i have asked why some brand controller, labeled as "crap" by most of us, continuously to perform extremely well, and in many cases even better then Sandforce on Anand Real World Benchmarks ( Read Toshiba Controller in Kingston V+ aka Apple's MBA SSD)
Chaser - Friday, February 25, 2011 - link
As SSDs become more common and second/third generations of models are starting to appear graph bars showing numerical values are beginning to got lost in haze. How would a "PC Mark Vantage score" difference of 3 points equate to an improved and noticable user experience? So while pages of "faster, higher" values might look appealing I am more lost now than anything else.For me, I enjoy reading conclusions similar to GPU results and comparisons. Such as, "If you have a Sandforce 1200 drive upgrading to this next generation wouldn't result in much or more of a noticable change on the average desktop enthusiast or gaming computer.
iwod - Friday, February 25, 2011 - link
The difference of 3 Points will be the same. Because it is within Margin or Error.Read up my post about you.
MamiyaOtaru - Friday, February 25, 2011 - link
"prices will continue to fall"been waiting for them to become reasonable for years now, and this gets repeated when they go up?
I'm hoping for great things from memristors
Spazweasel - Monday, February 28, 2011 - link
So here's a question. With these solid state hard drives bursting to near the maximum transfer rate of SATA3 and completely eclipsing spinning media, the Holy Grail is going to be to approach RAMdisk speed.I'd be curious to see how a drive like this compares to, say, a 4gb RAM disk which has been formatted with the same file system. I imagine the RAMdisk driver and operating system will matter a great deal for such a baseline, but if a RAMdisk driver and config can be settled upon, this would make a very interesting comparison.
As far as I can tell, the SATA3 standard, with 6Gb/sec (little B) will saturate at about 525MB/sec (big B). DDR3/1333 will do so at 10667MB/sec. 20 times faster, right? Well... maybe. This is where file system and driver overhead will loom large. RAID will fatten up the pipe, and ultimately PCIE 2.0 16x will peak at 8192MB/sec (big B). Since PCIE 2.0/16x is close to DDR3/1333 in transfer speeds, in theory (that wonderful place where everything works), the aforementioned Holy Grail is at least in sight at the horizon.
So yeah, I'm curious about RAMdisks vs. fast SSDs in RAID. Just as an exercise.
iwod - Tuesday, March 1, 2011 - link
I know this is old, but can you brief us on WHAT THE HELL HAPPEN to Intel SSD Controller?Was it always suppose to be a Marvel Controller + Intel Firmware? Are is there REAL G3 coming soon?
WintersEdge - Wednesday, March 9, 2011 - link
So this is a preview, right? Although it's quite complete like a full review... Nevertheless, you'll do another review when the product actually comes out? Right? Or what? If so, will you add your energy use test, like you've done for SSD reviews in the past? I know it'll be very small but then again, all the differences in performance are also very small to an end user just doing ordinary tasks.Thanks