OCZ Vertex 3 Pro Preview: The First SF-2500 SSD
by Anand Lal Shimpi on February 17, 2011 3:01 AM ESTThe Test
Note that I've pulled out our older results for the Kingston V+100. There were a couple of tests that had unusually high performance which I now believe was due the drive being run with a newer OS/software image than the rest of the older drives. I will be rerunning those benchmarks in the coming week.
I should also note that this is beta hardware running beta firmware. While the beta nature of the drive isn't really visible in any of our tests, I did attempt to use the Vertex 3 Pro as the primary drive in my 15-inch MacBook Pro on my trip to MWC. I did so with hopes of exposing any errors and bugs quicker than normal, and indeed I did. Under OS X on the MBP with a full image of tons of data/apps, the drive is basically unusable. I get super long read and write latency. I've already informed OCZ of the problem and I'd expect a solution before we get to final firmware. Often times actually using these drives is the only way to unmask issues like this.
| CPU |
Intel Core i7 965 running at 3.2GHz (Turbo & EIST Disabled) Intel Core i7 2600K running at 3.4GHz (Turbo & EIST Disabled) - for AT SB 2011 |
| Motherboard: |
Intel DX58SO (Intel X58) Intel H67 Motherboard |
| Chipset: |
Intel X58 + Marvell SATA 6Gbps PCIe Intel H67 |
| Chipset Drivers: |
Intel 9.1.1.1015 + Intel IMSM 8.9 Intel 9.1.1.1015 + Intel RST 10.2 |
| Memory: | Qimonda DDR3-1333 4 x 1GB (7-7-7-20) |
| Video Card: | eVGA GeForce GTX 285 |
| Video Drivers: | NVIDIA ForceWare 190.38 64-bit |
| Desktop Resolution: | 1920 x 1200 |
| OS: | Windows 7 x64 |
Random Read/Write Speed
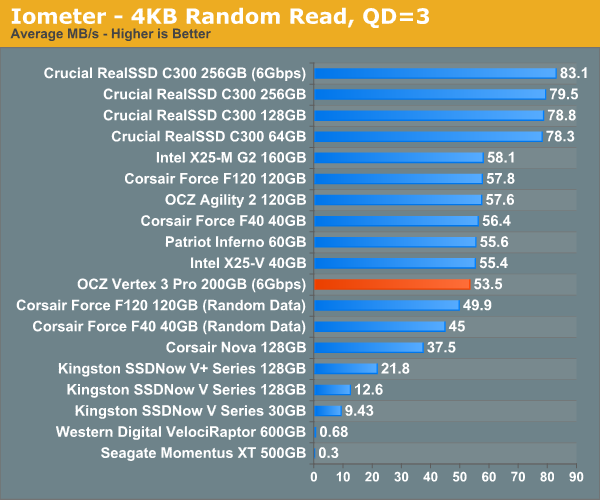
The four corners of SSD performance are as follows: random read, random write, sequential read and sequential write speed. Random accesses are generally small in size, while sequential accesses tend to be larger and thus we have the four Iometer tests we use in all of our reviews.
Our first test writes 4KB in a completely random pattern over an 8GB space of the drive to simulate the sort of random access that you'd see on an OS drive (even this is more stressful than a normal desktop user would see). I perform three concurrent IOs and run the test for 3 minutes. The results reported are in average MB/s over the entire time. We use both standard pseudo randomly generated data for each write as well as fully random data to show you both the maximum and minimum performance offered by SandForce based drives in these tests. The average performance of SF drives will likely be somewhere in between the two values for each drive you see in the graphs. For an understanding of why this matters, read our original SandForce article.
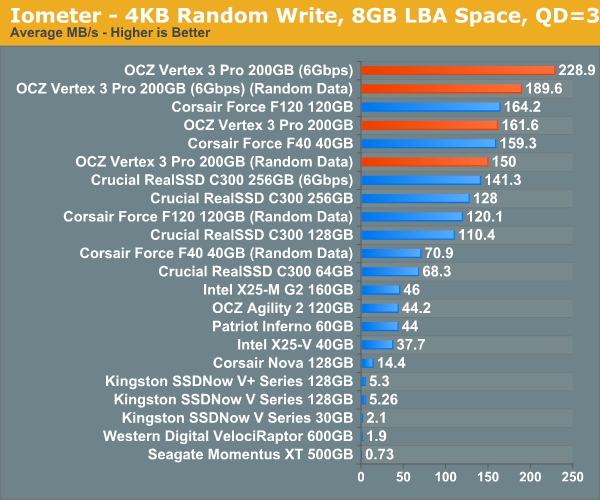
Random write performance is much better on the SF-2500, not that it was bad to begin with on the SF-1200. In fact, the closest competitor is the SF-1200, the rest don't stand a chance.
Many of you have asked for random write performance at higher queue depths. What I have below is our 4KB random write test performed at a queue depth of 32 instead of 3. While the vast majority of desktop usage models experience queue depths of 0 - 5, higher depths are possible in heavy I/O (and multi-user) workloads:
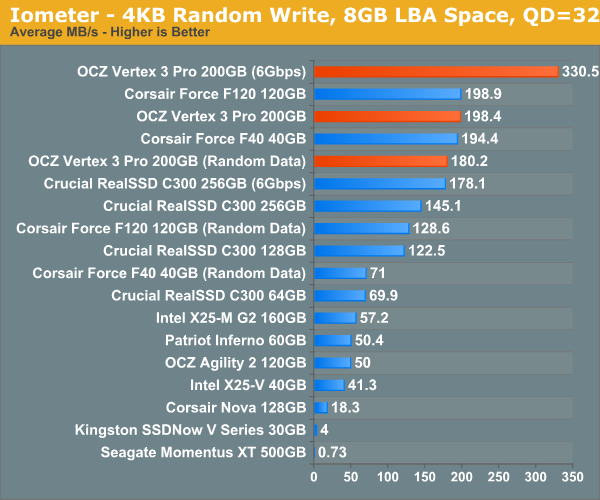
Ramp up the queue depth and there's still tons of performance on the table. At 3Gbps the performance of the Vertex 3 Pro is actually no different than the SF-1200 based Corsair Force, the SF-2500 is made for 6Gbps controllers.


144 Comments
View All Comments
bigboxes - Thursday, February 17, 2011 - link
Anand, I know you mentioned read/write and having your data a year after your last write. Does the future of SSD going to allow long-term storage on these devices? Will our data last longer than a year in storage or in use as read-only? I figured when cost went down and capacity went up that we'd start seeing SSD's truly replace HDD as the medium of long-term storage. Any insights into the (near) future?marraco - Thursday, February 17, 2011 - link
We need a roundup of SATA 6Gb controllers on AMD and Intel.How do added cards perform against integrated SATA 6Gb?
jwilliams4200 - Thursday, February 17, 2011 - link
Here are the numbers given in the AS-SSD incompressible write speed chart forSF-2500 (clean, dirty, after TRIM):
229.5 MB/s 230.0 MB/s 198.2 MB/s
Logically, I would expect the dirty number to be less than or equal to the after-TRIM number. Is there a typo here?
jwilliams4200 - Thursday, February 17, 2011 - link
Anand:Could you run the data files for your 2011 storage bench (heavy and light cases) through a couple of standard compression programs and report the compressed and uncompressed file sizes? That would be useful information to know when evaluating the performance of Sandforce SSDs on your storage benchmark.
Chloiber - Thursday, February 17, 2011 - link
Indeed, this would be an important piece of information.mstone29 - Thursday, February 17, 2011 - link
It's been out for a few weeks and the performance is on par w/ the OCZ V3.Does OCZ pay better?
Anand Lal Shimpi - Sunday, February 20, 2011 - link
We're still waiting for our Corsair P3 sample, as soon as we get it you'll see a review :)Take care,
Anand
gotFrosty - Thursday, February 17, 2011 - link
I personally will never buy from OCZ ever again... The way that they are treating the customers (including me) with this shady marketing scandal. Never will I deal with them. Never. Who is to say that they will not pull this crap somewhere down the line again.They changed the way they manufactured the drives. Ok thats well and fine, but at least change the product number/name whatever so that end users can distinguish between the products. Right now I'm sitting with a drive that they can't tell me whether its the slower 25nm or the 34. What kind of crap is that. I can't tell either because my build is waiting on the P67's to get fixed. Oh and to still market the drive as the same Vertex 2 that got all the great reviews.
Lets just say I'm a little irritated with the whole scheme. I feel robbed.
Mr Perfect - Friday, February 18, 2011 - link
Just stumbled across the whole Vertex 2 issue myself. Link to an explanation of what Frosty is mad about below:http://www.storagereview.com/ocz_issues_mea_culpa_...
I'm not impressed with OCZ right now. Anand, any way you could talk to OCZ about this issue?
db808 - Thursday, February 17, 2011 - link
Hi Anand,Thanks for another great SSD article. I own a OCZ Vertex 2 for my personal use, and I have been doing some testing of SSDs for work use.
I have a questions/comments that will probably stir up some additional discussion.
1) You present a good description on your personal workload write volume at 7GB / day, and how that even with that heavy amount of activity, the SSD life expectancy is much greater than the warranty period.
Did you ever try to correlate this with the life expectancy (or read and write activity) reported by the SSD using the SMART attributes?
In my first 3 weeks using a new Vertex 2 SSD as my boot disk, I averaged over 18 GB/day of write activity ... much greater than your reported 7 GB/day.
I can not say for other Sandforce implementations, but the OCZ Vertex 2 does report a wide variety of useful statistics via the vendor-specific SMART statistics. These statistics can be displayed using the OCZ Toolbox:
http://www.ocztechnologyforum.com/forum/showthread...
I don't know if other SSD vendors have similar information. Crystal Disk Info (http://crystalmark.info/software/CrystalDiskInfo/i... also displays and formats many of the vendor-specific fields, but I don't know if it specifically displays the extended info for specific SSDs.
Using the OCZ Toolbox (which works with all OCZ Sandforce SSDs), you can display a lot of interesting information. Here is the statistics for the first 3 weeks of usage from my SSD. No real benchmarking, just doing the initial install of Windows 7 64-bit, and then installing all the apps that I run. My 120 GB SSD is about half full, including a 8 gb page and 8 gb hiberbate file. I also relocated my Windows search index off the SSD. Temp IS on the SSD (my choice).
SMART READ DATA
Revision: 10
Attributes List
1: SSD Raw Read Error Rate Normalized Rate: 100 total ECC and RAISE errors
5: SSD Retired Block Count Reserve blocks remaining: 100%
9: SSD Power-On Hours Total hours power on: 351
12: SSD Power Cycle Count Count of power on/off cycles: 84
171: SSD Program Fail Count Total number of Flash program operation failures: 0
172: SSD Erase Fail Count Total number of Flash erase operation failures: 0
174: SSD Unexpected power loss count Total number of unexpected power loss: 19
177: SSD Wear Range Delta Delta between most-worn and least-worn Flash blocks: 0
181: SSD Program Fail Count Total number of Flash program operation failures: 0
182: SSD Erase Fail Count Total number of Flash erase operation failures: 0
187: SSD Reported Uncorrectable Errors Uncorrectable RAISE errors reported to the host for all data access: 0
194: SSD Temperature Monitoring Current: 1 High: 129 Low: 127
195: SSD ECC On-the-fly Count Normalized Rate: 100
196: SSD Reallocation Event Count Total number of reallocated Flash blocks: 0
231: SSD Life Left Approximate SDD life Remaining: 100%
241: SSD Lifetime writes from host Number of bytes written to SSD: 384 GB
242: SSD Lifetime reads from host Number of bytes read from SSD: 832 GB
For my first 3 weeks, using the PC primarily after work and on weekends, I averaged 18.2 GB/day of write activity ... or 384 GB total.
You may want to re-assess the classification of your 7 GB/day workload as "heavy". I don't think my 18.2 GB/day workload was extra heavy. My system has 8 GB of memory, and typically runs between 2-3 gb used, so I don't believe that there is a lot of activity to the page file. I have a hibernate file because I use a UPS, and it allows me to "resume" after a power blip vs. a full shutdown.
Well ... back to the point .... The OCZ toolbox reports an estimated remaining life expectancy. I have not run my SSD long enough to register a 1% usage yet, but I will be looking at what volume of total write activity finally triggers the disk to report only 99% remaining life.
I don't know if the OCZ Toolbox SMART reporting will work with non-OCZ Sandforce-based SSDs.
If you can get a life expectancy value from your Sandforce SSDs, it would be interesting to see how it correlates with your synthetic estimates.
Thanks again for a great article!