Intel’s Core i5-655K & Core i7-875K: Overclocked and Analyzed
by Rajinder Gill on May 28, 2010 5:00 AM ESTTestbed Setup
|
Testbed Setup Overclocking / Benchmark Testbed |
|
|
Processors Used: |
Intel i7-875K ES CPU, 2.93GHz, 8 Threads, 8MB Cache Intel i5-750 Retail, 2.66GHz, 4 Threads, 8MB Cache Intel i5-655K ES CPU, 3.20GHz, 2 Cores 4 Threads, 4MB Cache Intel i5-661 ES CPU, 3.33GHz, 2 Cores 4 Threads, 4MB Cache Intel i3-540 Retail, 3.06GHz, 2 Cores 4 Threads, 4MB Cache |
| CPU Voltage | Various |
| Cooling | Intel air cooler, Heatkiller 3.0 waterblock, ThermoChill PA120.2 radiator and DDC Ultra pump (with Petra top). 1/2" ID tubing for watercooling. |
| Power Supply | Corsair HX950 |
| Memory |
Corsair Dominator GT 8-8-8-24 2200MHz 4GB kit (X2 for 8GB) |
| Memory Settings | 8-8-8-24 - 1T |
| Video Cards | MSI 275 Lightning (stock clocks) |
| Video Drivers | nVidia 195.62 WHQL |
| Hard Drive |
Western Digital 7200RPM 1TB SATA 3/Gbps 32MB OCZ Vertex 120GB SSD |
| Optical Drives | Plextor PX-B900A, Toshiba SD-H802A |
| Case |
Open Test Bed - Dimastech Benching Station Lian-Li V2110 |
| Operating System | Windows 7 64-bit |
| . | |
EVGA’s Classified motherboard was used for all of the overclocking and power consumption plots. We used a DC clamp meter directly on the EPS 12V power line to monitor current draw to VCC and VTT. Fortunately, we happen to know the approximate efficiency curve of the Volterra VRM so have taken the time to account for the switching losses in all figures shown.
Corsair’s Dominator GT 2200MHz kit was used at CAS 8-8-8-24 timings from DDR-3 1333MHz ~ DDR3 1820MHz. Not exactly tight for this kit, but representative of the memory timings many users will run using affordable memory kits on these processors (given the nature of the Clarkdale IMC).
For comparative purposes, all components used were exactly the same throughout our testing. All memory timings and bus frequencies were matched up as needed (unless specified otherwise).
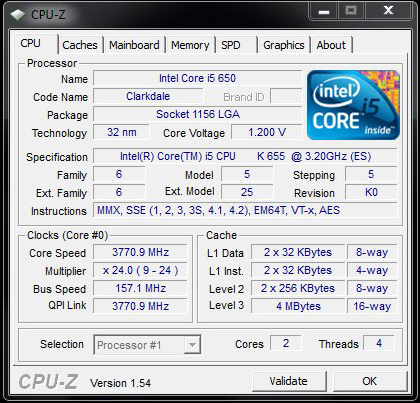
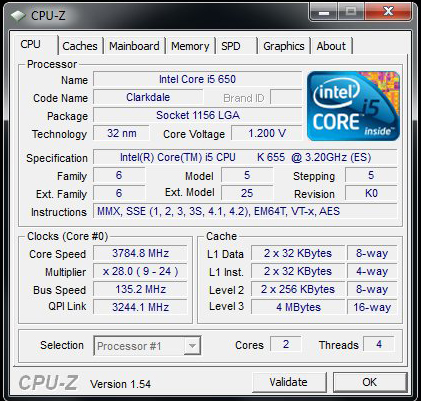
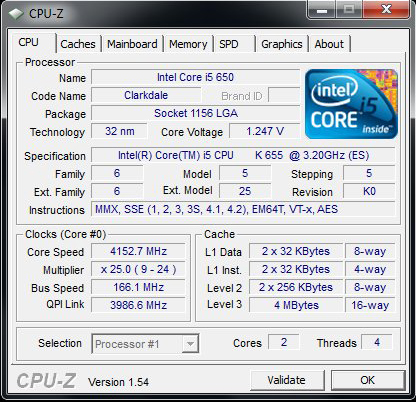
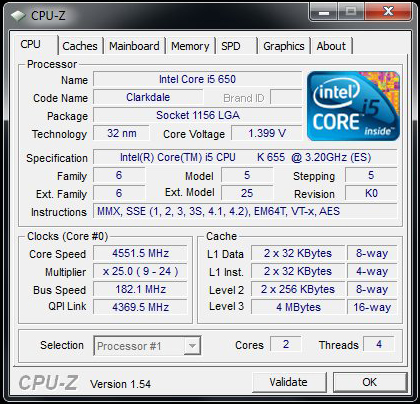
Clarkdale i5-655K Overclocking
We’ll start off with the basics. First off, the maximum overclock using stock voltages:
Next up, maximum stable overclocks:
We’re often criticized for being a little brief and thin on overclocking results for our processor launch articles so we’re going to break things down a little further today and take a look at sensible operating points and compare the power curves of different processors.
VID, VCC & Relative Frequency Scaling
First up, let’s take a look at the stock voltages programmed by Intel (VID) for each processor on test today, and the required voltage under full Linpack load at stock frequency and 4.55GHz.
Do note, that actual load voltages will vary from board to board depending upon loadline resistance, Voffset and Vdroop. For the uninitiated, Voffset is difference between the applied voltage and the actual idle state voltage, while Vdroop is the level of voltage sag between idle and full load processor states. These safety margins are necessary to ensure that the real time voltage level (VCC), does not breach the applied VID for extensive periods or by excessive levels (acceptable overshoot margins are stipulated in the Intel white papers). Further explanation of these design principals is provided here.
| Processor | Stock Frequency | Turbo Mode | Stock VID | Stock VCC (Load) | VCC @ ~4.55GHz (Load)* |
| i3-540 | 3.06GHz | N/A | 1.0500V | 1.029V | 1.323V |
| i5-655K | 3.20GHz | 3.46GHz | 1.2125V | 1.190V | 1.378V |
| i5-661 | 3.33GHz | 3.6GHz | 1.1625V | 1.143V | 1.306V |
*Overclocked voltage requirements using water-cooling.
At first glance, the i5-661 stands out for having a relatively low stock VID in relation to its maximum single-threaded Turbo mode speed of 3.6GHz. That’s 160MHz higher than the i5-655K with a small reduction in voltage. Not only that, but it manages to reach 4.55GHz using the lowest VCC of these three test samples.
Here’s a graphical representation of how each processor scales frequency versus voltage, normalized to each part's stock VCC:

Of course, this is but a mere portion of the story, what we’re interested in is the power consumption of each processor at equivalent frequencies and how that has an impact on frequency scaling given various forms of cooling.


51 Comments
View All Comments
Rajinder Gill - Tuesday, June 1, 2010 - link
As the graphs state - this is VCC/VTT power only, the two major power rails of this architecture. The 12V ATX fan headers and PCIe 12V only on the E659 motherboard. Power to DDR3 is not something I focused on but may do in a future piece (there will be a frequency proportional rise in power provided timings are not changed). A very crude guess - I'd expect the rise over stock to be around 5 watts on the DRAM side in this frequency band (and total draw to be no more than 10~15w). Although figures would differ according to the scaling capabilities of various modules.Other than that, there's not much else aside from CPU PLL which is specified at around 1.1 amps at 1.8V (around 2-3 watts tops).
Rajinder Gill - Tuesday, June 1, 2010 - link
EDIT: The 12V ATX fan headers and PCIe 12V only on the E659 motherboard.That should read the 12V ATX line supplies fan headers and PCIe 12V power only. The 3.3v and 5V rails supply DDR, CPU PLL, IOH (and all derivatives such as IOH PLL, SB~IOH termination voltage etc).
Later
Raja
DanNeely - Tuesday, June 1, 2010 - link
Time permitting I'd be interested in seeing those numbers as well. I understand your desire to measure power consumption closer to the source. My concern is that increased power consumption from the secondary items you're not measuring is a black box; while the AC-DC conversion loss in the PSU from measuring power at the wall can be mostly corrected away by looking at what the efficiency rating of the PSU used in the test setup is.DanNeely - Tuesday, June 1, 2010 - link
Time permitting I'd be interested in seeing those numbers as well. I understand your desire to measure power consumption closer to the source. My concern is that increased power consumption from the secondary items you're not measuring is a black box; while the AC-DC conversion loss in the PSU from measuring power at the wall can be mostly corrected away by looking at what the efficiency rating of the PSU used in the test setup is.Rajinder Gill - Tuesday, June 1, 2010 - link
I prefer to keep things at the DC level. There are plenty of articles covering wall level consumption with your standard kill-a-watt type unit (and they also state the PSU used so users can factor out the losses if they know the effective efficiency curve). I think you are worrying too much about the lesser rails. Sure they will make interesting reading at some point - but there is nothing that pulls more than a couple of amps so the effects on power consumption will not be huge.Regards
Raja
Rajinder Gill - Tuesday, June 1, 2010 - link
Ok "DanNeely", this is for you,I just ran tests on the 3.3V and 5V rails. At stock the combined power consumption of these two rails on the E659. Bear in mind this is an enthusiast level board (higher switching losses due to higher switching speeds on VDIMM, plus using an NF200 for PEG multiplexing):
Running DDR3-1333 CAS 8-8-8-24 with 4GB of memory. (3.3v + 5V rails combined).
20.2 watts idle
Linpack load = 26.36 Watts.
That's a change of 6 Watts between idle and load.
At 4.551GHz, now running DDR3-1820 (1.60 VDIMM):
Idle = 22.86 Watts (2 Watt idle increase)
Load = 27.86 Watts.
That's a 1 Watt increase over stock speeds under load with an overclock of 1GHz on the CPU (running QPI over 4GHz). Hardly worth writing about. Do note - the effective change will vary from board to board according to VRM switching efficiency (which is coming into play if you look at the deltas between idle and load). Of course, I am not including things like HDD's etc although, some of the static 3.3V and 5V rail consumption is due to the GPU (GTX 275) which also draws a little power from that rail.
Hope that answers your questions.
Regards
Raja
DanNeely - Tuesday, June 1, 2010 - link
yes it did. thank you.tno - Friday, May 28, 2010 - link
Setting aside typos, I know wall of text is to be avoided but this felt almost like the opposite problem. Additional clicks for additional adviews. Clearly you didn't like what you saw out of the chips despite the voltage improvements evident in the more modest chip. Yet in the end despite devoting 1/9th of the coverage to it, you reward your recommendation to the pricier chip just one page after showing it severely underperforming its non-K analogue in both overclocking and voltage.I have said it before and I think its worth mentioning again, clearly there is a lo of passion for tech in the growing AnandTech team, but maybe adding a team member whose passion is writing and across whose hands every article will pass would give the site that extra polish that elevates it from other tech sites.
Jason
7Enigma - Friday, May 28, 2010 - link
At first I thought the same thing (saying nothing at all in the final page about the 655K does leave me puzzled as it is good), but Rijinder did clarify his recommendation for the 875K by saying PRICE. He is saying for the price of these chips and where they fall in line with the rest of the offerings from AMD and INTEL, the 875K is in a sweet spot. Remember the 655K is a dual-core,4 thread chip for $215 (lots of competition from both camps), while the 875K is a quad-core, 8 thread chip for under $350.In the end (and after re-reading the conclusion and article) I think the last page needs to have a bit more meat behind it. The data in the article itself is very detailed, but the final wrap-up needs some work. But honestly, since it's a free site, I'll take the good data and sketchy conclusions (I tend to make my own).
Thanks for the article!
troun - Friday, May 28, 2010 - link
"Past 3.9GHz, we’re already looking at a 10W increase in power consumption for every 20 MHz rise in CPU frequency"
But I read 20W for 100Mhz (or 10W for 50Mhz), with ~160W @ 3.9Ghz and ~180W @ 4Ghz...
However very interesting article, a similar curve (W/Mhz) would be also appreciate for an i7 9x0 comparison, 32nm Vs 45nm (980 Vs 930?).