Intel's X25-V & Kingston's 30GB SSDNow V Series: Battle of the $125 SSDs
by Anand Lal Shimpi on March 19, 2010 12:00 AM EST- Posted in
- Storage
AnandTech Storage Bench
Note that our 6Gbps controller driver isn't supported by our custom storage bench here, so the C300 results are only offered in 3Gbps mode.
The first in our benchmark suite is a light usage case. The Windows 7 system is loaded with Firefox, Office 2007 and Adobe Reader among other applications. With Firefox we browse web pages like Facebook, AnandTech, Digg and other sites. Outlook is also running and we use it to check emails, create and send a message with a PDF attachment. Adobe Reader is used to view some PDFs. Excel 2007 is used to create a spreadsheet, graphs and save the document. The same goes for Word 2007. We open and step through a presentation in PowerPoint 2007 received as an email attachment before saving it to the desktop. Finally we watch a bit of a Firefly episode in Windows Media Player 11.
There’s some level of multitasking going on here but it’s not unreasonable by any means. Generally the application tasks proceed linearly, with the exception of things like web browsing which may happen in between one of the other tasks.
The recording is played back on all of our drives here today. Remember that we’re isolating disk performance, all we’re doing is playing back every single disk access that happened in that ~5 minute period of usage. The light workload is composed of 37,501 reads and 20,268 writes. Over 30% of the IOs are 4KB, 11% are 16KB, 22% are 32KB and approximately 13% are 64KB in size. Less than 30% of the operations are absolutely sequential in nature. Average queue depth is 6.09 IOs.
The performance results are reported in average I/O Operations per Second (IOPS):
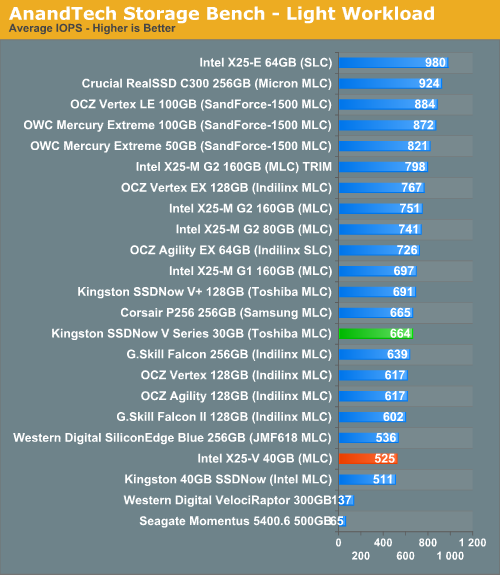
Intel's X25-V performs virtually identically to the older Kingston 40GB Boot Drive. The new 30GB drive does have the advantage though, performing much more like an Indilinx drive than a scaled down X25-M thanks to its higher sequential write speed.
If there’s a light usage case there’s bound to be a heavy one. In this test we have Microsoft Security Essentials running in the background with real time virus scanning enabled. We also perform a quick scan in the middle of the test. Firefox, Outlook, Excel, Word and Powerpoint are all used the same as they were in the light test. We add Photoshop CS4 to the mix, opening a bunch of 12MP images, editing them, then saving them as highly compressed JPGs for web publishing. Windows 7’s picture viewer is used to view a bunch of pictures on the hard drive. We use 7-zip to create and extract .7z archives. Downloading is also prominently featured in our heavy test; we download large files from the Internet during portions of the benchmark, as well as use uTorrent to grab a couple of torrents. Some of the applications in use are installed during the benchmark, Windows updates are also installed. Towards the end of the test we launch World of Warcraft, play for a few minutes, then delete the folder. This test also takes into account all of the disk accesses that happen while the OS is booting.
The benchmark is 22 minutes long and it consists of 128,895 read operations and 72,411 write operations. Roughly 44% of all IOs were sequential. Approximately 30% of all accesses were 4KB in size, 12% were 16KB in size, 14% were 32KB and 20% were 64KB. Average queue depth was 3.59.
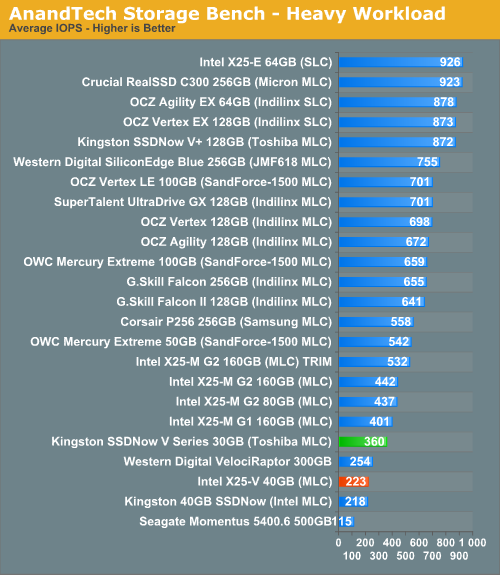
Crank up the sequential writes and Kingston's lead grows. The 30GB V series drive almost performs like an X25-M G1 in this case. The X25-V on the other hand performs more like a low latency VelociRaptor. Still better than a hard drive, but don't expect to copy files any faster.
The gaming workload is made up of 75,206 read operations and only 4,592 write operations. Only 20% of the accesses are 4KB in size, nearly 40% are 64KB and 20% are 32KB. A whopping 69% of the IOs are sequential, meaning this is predominantly a sequential read benchmark. The average queue depth is 7.76 IOs.
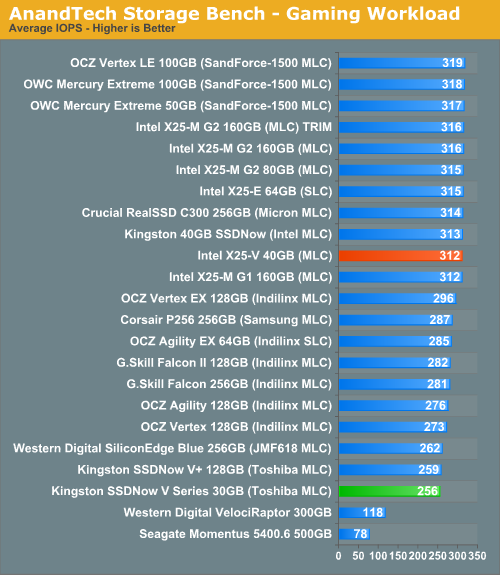
With both Intel and Kingston equal in sequential read performance, the differentiating factor here is strictly random read performance where the X25-V has the edge.


78 Comments
View All Comments
davepermen - Friday, March 19, 2010 - link
technically, still more expensive than the intel 40gb at 125$ (per gb), but yeah, others than just kingston and intel should be listed.still i'm glad for the 33% more storage :)
buzznut - Monday, March 22, 2010 - link
Yeah, this is the decision I made when buying my 40gig. With a win7 install those 10gb make a huge difference. For an entry level SSD, I would recommend the Intel over the OCZ despite some performance differences. Especially when it comes to gaming.Choosing between the Kingston drive and Intel at the time was a no-brainer.
However I would/will look at OCZ vertex series when going to 60GB or higher capacity.
mmntech - Friday, March 19, 2010 - link
It's progress in the right direction though. Wasn't long ago when these small drives were $200-$300. Still, I'm going to wait until 80gb SSDs drop to around that price. More breathing room. Still way too small for laptop use too.vol7ron - Friday, March 19, 2010 - link
I'd like to see the 80GB/160GBs fall in price too. Once they do, I'll consume =]MadMan007 - Friday, March 19, 2010 - link
When you talk about capacities in the chart on page 4 I take it the formatted capacity is in gigabytes (GB) and not gibibytes (GiB). So on top of reserved flash there is also the GB-GiB conversion to account for?gaspard - Friday, March 19, 2010 - link
Harddrives are measured in Gigabytes (1 billion bytes), Operating systems (Windows for example) usually measure in Gibibytes... aka 1024 times 1024 times 1024 = 1,073,741,824 bytesMadMan007 - Friday, March 19, 2010 - link
Thanks bro but that didn't add or clarify anything about my question. The fact that HDs use GB and OSes use GiB was implicit background knowledge for my post. I see Jarrod made a guess but I'd still be interested to know whether the chart on page 4 for formatted capacities especially and others just for funsies is in GB or GiB.JarredWalton - Friday, March 19, 2010 - link
And flash chips are generally measured in GiB as well (or at least, the chips come in powers of 2). I think part of this is SSD makers figure they'll use the GiB vs. GB difference to make up for their spare area. So you can have 7.3% spare area and your 40GiB SSD ends up formatting to the same size as a 40GB HDD. Just a thought.GullLars - Friday, March 19, 2010 - link
This was a good test, and one i've been waiting for a while. I'm a bit disappointed a 32GB Indilinx Barefoot drive wasn't included. I have a 30GB Vertex in my laptop that performs better sequentailly than these numbers, and has better random performance than the Kingston V 30GB. The price is slightly higher though.Ref screenshot: http://www.diskusjon.no/index.php?app=core&mod...">http://www.diskusjon.no/index.php?app=c...h_rel_mo... CDM 3.0 + WEI for my laptop.
Now the next thing I hope Anandtech will do regarding SSDs is a comparison of RAID of low-capasity cheap SSDs VS single high capasity SSDs. This is something no other reckognized tech site has done yet, but enthusiasts have done for years now. Example: http://www.nextlevelhardware.com/storage/battleshi...">http://www.nextlevelhardware.com/storage/battleshi...
I'll also mention Nizzen, an enthusiast on a forum i frequent, who set a WR i PCmark vantage last spring with his 24/7 setup, and is still on top5 with the same setup (updated in august with 4GB RAM on the Areca). The key was an Areca 1680ix-12 with a RAID-0 of several (7 i think) OCZ Vertex.
ORB result page: http://service.futuremark.com/resultComparison.act...">http://service.futuremark.com/resultCom...sultId=2...
24740 PCmarks, WAY ahead of the highest score in your benchmark lists. The same level of disk performance is possible to get with an LSI 9211-8i with 8 30-40GB SSDs in RAID-0 for about $1000 (less than 2 256GB SSDs).
Suggested lineup for such an article: RAID-0 of 4 Kingston V 30GB, Intel x25-V, and Indilinx Barefoot 32GB (Vertex?). 2 RAID-0 SF-1200/1500 50GB, Kingston SSDNow V+ 64GB, Indilinx Barefoot 64GB, Intel x25-M 80GB. And single 100/128/160 GB SSDs of various controllers.
Regarding performance degrading in RAID whitout TRIM, increased reserved area can help negate the performance degrading (Ref IDF whitepaper on spare area). Increasing the spare area to ~20-25% from the default 7% (on most SSDs) will make sure degrading will not be noticable by users in normale usage models.
strikeback03 - Friday, March 19, 2010 - link
So how much faster were program loads and other useful things with that super RAID array?