OWC Mercury Extreme SSD - First Look at a 50GB SandForce Drive
by Anand Lal Shimpi on February 26, 2010 12:00 AM EST- Posted in
- Storage
AnandTech Storage Bench
Note that our 6Gbps controller driver isn't supported by our custom storage bench here, so the C300 results are only offered in 3Gbps mode.
The first in our benchmark suite is a light usage case. The Windows 7 system is loaded with Firefox, Office 2007 and Adobe Reader among other applications. With Firefox we browse web pages like Facebook, AnandTech, Digg and other sites. Outlook is also running and we use it to check emails, create and send a message with a PDF attachment. Adobe Reader is used to view some PDFs. Excel 2007 is used to create a spreadsheet, graphs and save the document. The same goes for Word 2007. We open and step through a presentation in PowerPoint 2007 received as an email attachment before saving it to the desktop. Finally we watch a bit of a Firefly episode in Windows Media Player 11.
There’s some level of multitasking going on here but it’s not unreasonable by any means. Generally the application tasks proceed linearly, with the exception of things like web browsing which may happen in between one of the other tasks.
The recording is played back on all of our drives here today. Remember that we’re isolating disk performance, all we’re doing is playing back every single disk access that happened in that ~5 minute period of usage. The light workload is composed of 37,501 reads and 20,268 writes. Over 30% of the IOs are 4KB, 11% are 16KB, 22% are 32KB and approximately 13% are 64KB in size. Less than 30% of the operations are absolutely sequential in nature. Average queue depth is 6.09 IOs.
The performance results are reported in average I/O Operations per Second (IOPS):
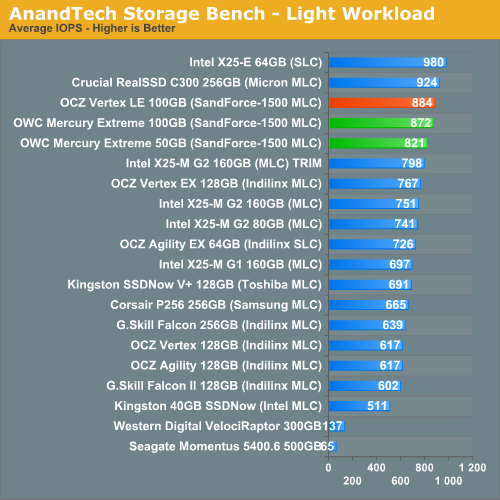
In our light workload we see a small performance drop from the 100GB to 50GB capacity point. It's nothing tremendous though and definitely not noticeable in real world usage. Other than the usual performance degradation issues you see with running an SSD close to max capacity, you shouldn't really see any difference in performance between a 50GB or a 100GB SandForce drive.
If there’s a light usage case there’s bound to be a heavy one. In this test we have Microsoft Security Essentials running in the background with real time virus scanning enabled. We also perform a quick scan in the middle of the test. Firefox, Outlook, Excel, Word and Powerpoint are all used the same as they were in the light test. We add Photoshop CS4 to the mix, opening a bunch of 12MP images, editing them, then saving them as highly compressed JPGs for web publishing. Windows 7’s picture viewer is used to view a bunch of pictures on the hard drive. We use 7-zip to create and extract .7z archives. Downloading is also prominently featured in our heavy test; we download large files from the Internet during portions of the benchmark, as well as use uTorrent to grab a couple of torrents. Some of the applications in use are installed during the benchmark, Windows updates are also installed. Towards the end of the test we launch World of Warcraft, play for a few minutes, then delete the folder. This test also takes into account all of the disk accesses that happen while the OS is booting.
The benchmark is 22 minutes long and it consists of 128,895 read operations and 72,411 write operations. Roughly 44% of all IOs were sequential. Approximately 30% of all accesses were 4KB in size, 12% were 16KB in size, 14% were 32KB and 20% were 64KB. Average queue depth was 3.59.
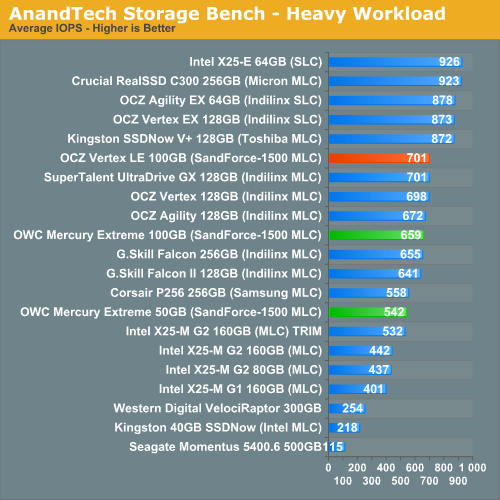
Crank up the IOPS and our 50GB drive stops doing so well. I should point out that despite its fall from grace, the 50GB OWC drive is still as fast as the 160GB Intel X25-M G2. While there's indeed a drop in random write speed, it doesn't appear to be a crippling drop.
Our final test focuses on actual gameplay in four 3D games: World of Warcraft, Batman: Arkham Asylum, FarCry 2 and Risen, in that order. The games are launched and played, altogether for a total of just under 30 minutes. The benchmark measures game load time, level load time, disk accesses from save games and normal data streaming during gameplay.
The gaming workload is made up of 75,206 read operations and only 4,592 write operations. Only 20% of the accesses are 4KB in size, nearly 40% are 64KB and 20% are 32KB. A whopping 69% of the IOs are sequential, meaning this is predominantly a sequential read benchmark. The average queue depth is 7.76 IOs.
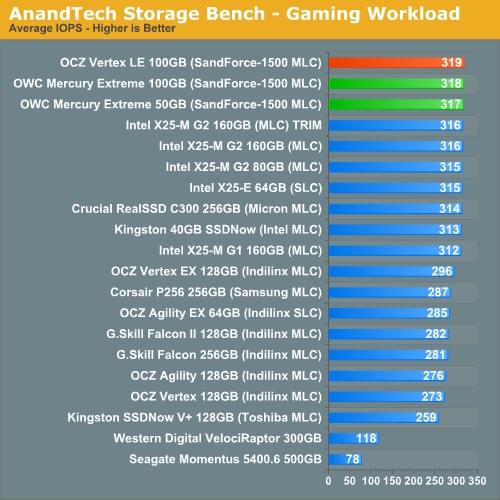
We've already shown that read speeds are no lower with the 50GB drive, and thus our gaming workload which involves mostly texture/level loads off of the SSD shows no difference between the various capacity points of SandForce drives. We're still very bottlenecked by 3Gbps SATA here.


74 Comments
View All Comments
Anand Lal Shimpi - Saturday, February 27, 2010 - link
I present the inverse of average latency - IOPS :) Take 1/IOPS and you'll get average latency per IO. I figure it's easier to convey performance this way (bigger numbers mean better performance).Take care,
Anand
ssdreviewer - Saturday, February 27, 2010 - link
as the following posts already pointed out, that's not the case. it would be better you could present directly minimum/average/maximum latency data, rather than IOPS, which has no linear relations with latency under different QD. my applications rely more on latency than random r/w or IOPS, i.e. responsiveness is more crucial here. that being said, i would like to see more direct results from AS SSD and HDTune Pro access time tests. thanks.jimhsu - Saturday, February 27, 2010 - link
That method can't give you information on maximum IO latency (which for me is the critical one, if you're concerned with gaming, real time video streaming, multimedia creation, etc). A drive with 0.1 ms latency but that peaks at 500 ms could be subjectively worse than one with 0.2 ms latency but that peaks at 100 ms.GullLars - Saturday, February 27, 2010 - link
Actually, you need to take Queue Depth (QD) into account. This noted the formula is QD/IOPS, since IOPS = 1/([average accesstime]*[QD]) (this formula is known as Littles Law). If you test at QD=1, 1/IOPS = average accesstime, it's a special case. Since your IOPS tests are at QD 3 and IOPS is represented as bandwidth (IOPS*block size), you find average accesstime (at QD 3) in ms by the formula 3/([bandwidth in MB/s]/4(KB)) (not factoring in MB/KB means s->ms) = 12/[bandwidth in MB/s].From my SSD project a month back, i found average accesstime increases as QD increases, and when QD=#channels average accesstime double when QD doubles. The reason for increased accesstime up to QD=#flash channels are (primarily) in two parts.
1. Statistical distribution says some channels will get multiple requests in queue while some go unused, therefore # of saturated channels < QD. The channels with queue will have single accesstime multiplied with queue lenght for average accesstime.
2. Controller NCQ overhead, the controller adds latency when administrating the queue.
Paladin1211 - Friday, February 26, 2010 - link
I just look at the AnandTech Storage Bench charts, the Kingston V+ performs so good, going neck and neck with Intel and Indilinx MLC in Heavy Workload. How could it be that fast, Anand?Paladin1211 - Friday, February 26, 2010 - link
Ops, I mean SLC, not MLC.Too good to be true...
Paladin1211 - Friday, February 26, 2010 - link
In random write/read test, the V+ scores are so poor. Something is not right here.Anand Lal Shimpi - Saturday, February 27, 2010 - link
The heavy workload is nearly half sequential. It's a heavy downloading and multitasking workload, which has thus far paved the way for a few unexpected strong performers. Remember that most controller makers actually optimize for sequential performance, which this benchmark tests more than any of the other tests. I still can't quite figure out why the Toshiba controller does so well here other than that it must really be tuned for this type of a workload. I've run and re-run the test, the results are always the same.Take care,
Anand
GullLars - Friday, February 26, 2010 - link
Just thought I'd add a link to a couple of graphs i made of IOPS scaling as a function of Queue Depth for 1-4 x25-V in RAID 0 from ICH10R compared to x25-M 80GB and 160GB, and 2 x25-M 80GB RAID 0. These are in the same price range, and the graphs will show why i think Anands reviews don't show the whole truth when there is no test beyond QD 8.link: http://www.diskusjon.no/index.php?app=core&mod...">http://www.diskusjon.no/index.php?app=c...h_rel_mo...
The tests were done by 3 users at a forum i frequent, the username is in front of the setup that was benched.
The IOmeter config run was: 1GB testfile, 30 sec run, 2 sec ramp. Block sizes 0,5KB, 4KB, 16KB, 64KB. Queue Depths 1-128, 2^n stepping. This is a small part of a project from a month back mapping SSD and SSD RAID scaling by block size and queue depth (block sizes 0,5KB-64KB 2^n stepping, QD 1-128 2^n stepping).
ATTO is also nice to show scaling of sequential performance by block size (and possibly queue depth).
cditty - Friday, February 26, 2010 - link
Another great article. I have to give it to you, Anand. Your SSD coverage is by far the best on the net. I have learned so much from your various articles.