OWC Mercury Extreme SSD - First Look at a 50GB SandForce Drive
by Anand Lal Shimpi on February 26, 2010 12:00 AM EST- Posted in
- Storage
Overall System Performance using PCMark Vantage
Next up is PCMark Vantage, another system-wide performance suite. For those of you who aren’t familiar with PCMark Vantage, it ends up being the most real-world-like hard drive test I can come up with. It runs things like application launches, file searches, web browsing, contacts searching, video playback, photo editing and other completely mundane but real-world tasks. I’ve described the benchmark in great detail before but if you’d like to read up on what it does in particular, take a look at Futuremark’s whitepaper on the benchmark; it’s not perfect, but it’s good enough to be a member of a comprehensive storage benchmark suite. Any performance impacts here would most likely be reflected in the real world.
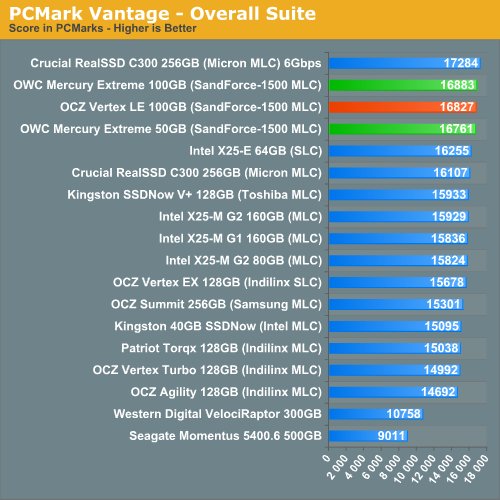
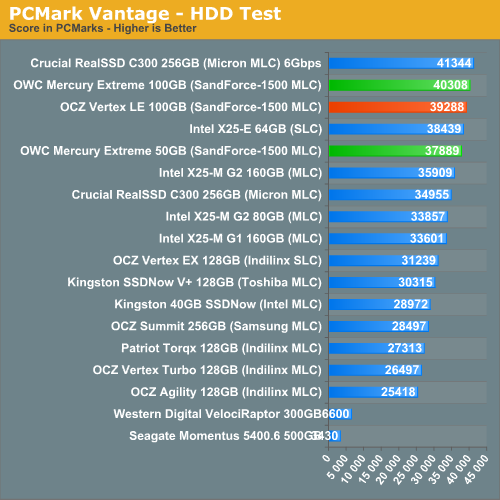
PCMark Vantage mostly echoes what you'd expect based on our data thus far. There's no real performance difference, in the real world, between the 100GB and 50GB SandForce SF-1500 MLC drives. It's only in the HDD specific test that we see any evidence of a slower drive, and even then the drop isn't that great.
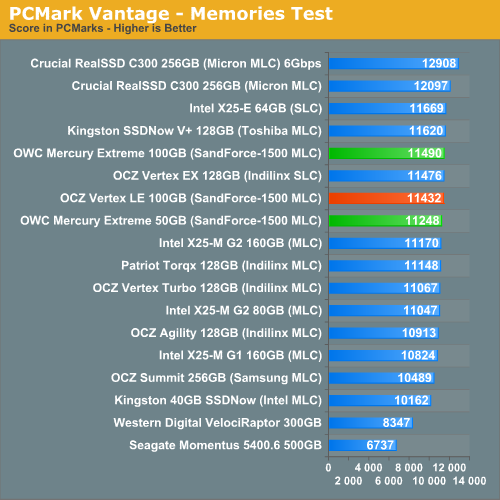
The memories suite includes a test involving importing pictures into Windows Photo Gallery and editing them, a fairly benign task that easily falls into the category of being very influenced by disk performance.
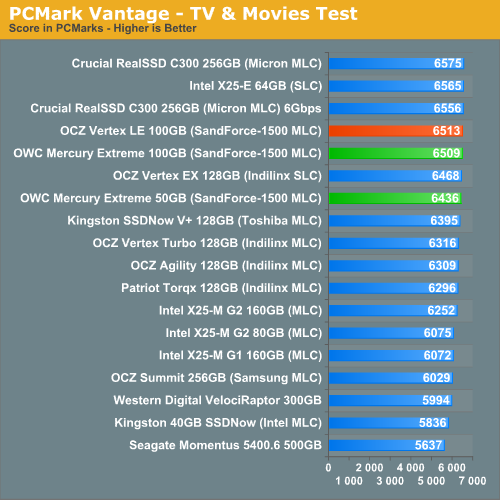
The TV and Movies tests focus on on video transcoding which is mostly CPU bound, but one of the tests involves Windows Media Center which tends to be disk bound.
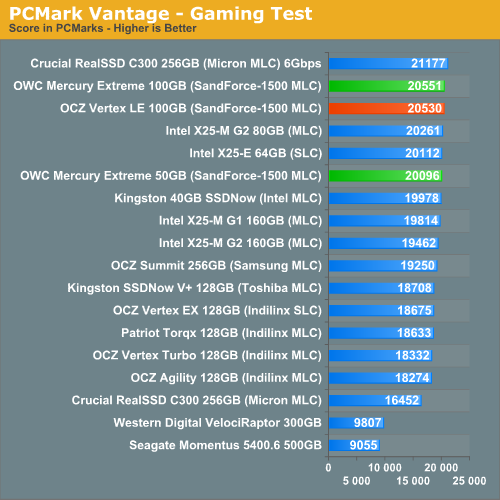
The gaming tests are very well suited to SSDs since they spend a good portion of their time focusing on reading textures and loading level data. All of the SSDs dominate here, but as you'll see later on in my gaming tests the benefits of an SSD really vary depending on the game. Take these results as a best case scenario of what can happen, not the norm.
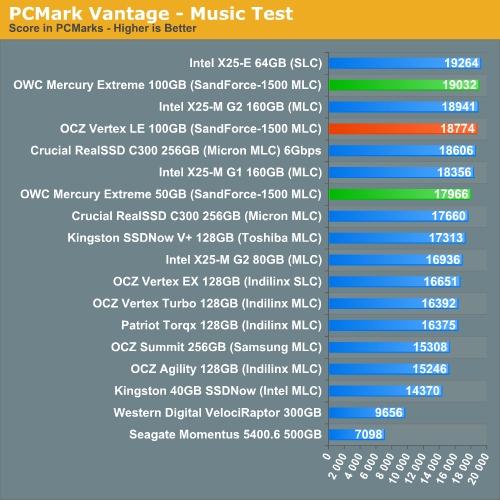
In the Music suite the main test is a multitasking scenario: the test simulates surfing the web in IE7, transcoding an audio file and adding music to Windows Media Player (the most disk intensive portion of the test).
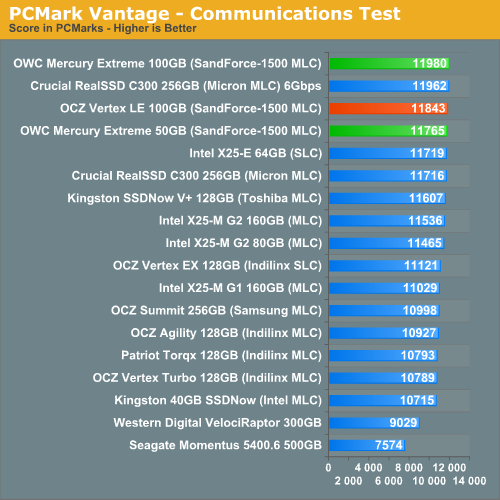
The Communications suite is made up of two tests, both involving light multitasking. The first test simulates data encryption/decryption while running message rules in Windows Mail. The second test simulates web surfing (including opening/closing tabs) in IE7, data decryption and running Windows Defender.
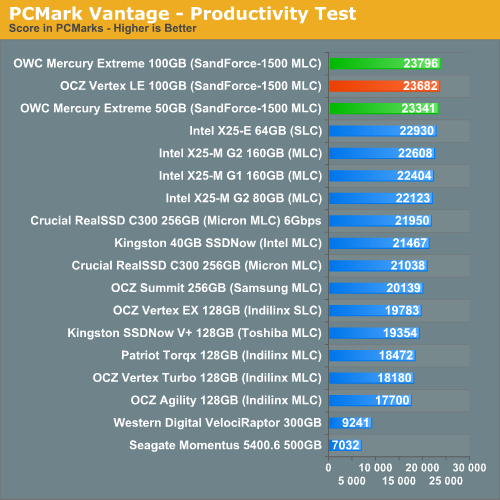
I love PCMark's Productivity test; in this test there are four tasks going on at once, searching through Windows contacts, searching through Windows Mail, browsing multiple webpages in IE7 and loading applications. This is as real world of a scenario as you get and it happens to be representative of one of the most frustrating HDD usage models - trying to do multiple things at once. There's nothing more annoying than trying to launch a simple application while you're doing other things in the background and have the load take forever.
The final PCMark Vantage suite is HDD specific and this is where you'll see the biggest differences between the drives:


74 Comments
View All Comments
Anand Lal Shimpi - Saturday, February 27, 2010 - link
I present the inverse of average latency - IOPS :) Take 1/IOPS and you'll get average latency per IO. I figure it's easier to convey performance this way (bigger numbers mean better performance).Take care,
Anand
ssdreviewer - Saturday, February 27, 2010 - link
as the following posts already pointed out, that's not the case. it would be better you could present directly minimum/average/maximum latency data, rather than IOPS, which has no linear relations with latency under different QD. my applications rely more on latency than random r/w or IOPS, i.e. responsiveness is more crucial here. that being said, i would like to see more direct results from AS SSD and HDTune Pro access time tests. thanks.jimhsu - Saturday, February 27, 2010 - link
That method can't give you information on maximum IO latency (which for me is the critical one, if you're concerned with gaming, real time video streaming, multimedia creation, etc). A drive with 0.1 ms latency but that peaks at 500 ms could be subjectively worse than one with 0.2 ms latency but that peaks at 100 ms.GullLars - Saturday, February 27, 2010 - link
Actually, you need to take Queue Depth (QD) into account. This noted the formula is QD/IOPS, since IOPS = 1/([average accesstime]*[QD]) (this formula is known as Littles Law). If you test at QD=1, 1/IOPS = average accesstime, it's a special case. Since your IOPS tests are at QD 3 and IOPS is represented as bandwidth (IOPS*block size), you find average accesstime (at QD 3) in ms by the formula 3/([bandwidth in MB/s]/4(KB)) (not factoring in MB/KB means s->ms) = 12/[bandwidth in MB/s].From my SSD project a month back, i found average accesstime increases as QD increases, and when QD=#channels average accesstime double when QD doubles. The reason for increased accesstime up to QD=#flash channels are (primarily) in two parts.
1. Statistical distribution says some channels will get multiple requests in queue while some go unused, therefore # of saturated channels < QD. The channels with queue will have single accesstime multiplied with queue lenght for average accesstime.
2. Controller NCQ overhead, the controller adds latency when administrating the queue.
Paladin1211 - Friday, February 26, 2010 - link
I just look at the AnandTech Storage Bench charts, the Kingston V+ performs so good, going neck and neck with Intel and Indilinx MLC in Heavy Workload. How could it be that fast, Anand?Paladin1211 - Friday, February 26, 2010 - link
Ops, I mean SLC, not MLC.Too good to be true...
Paladin1211 - Friday, February 26, 2010 - link
In random write/read test, the V+ scores are so poor. Something is not right here.Anand Lal Shimpi - Saturday, February 27, 2010 - link
The heavy workload is nearly half sequential. It's a heavy downloading and multitasking workload, which has thus far paved the way for a few unexpected strong performers. Remember that most controller makers actually optimize for sequential performance, which this benchmark tests more than any of the other tests. I still can't quite figure out why the Toshiba controller does so well here other than that it must really be tuned for this type of a workload. I've run and re-run the test, the results are always the same.Take care,
Anand
GullLars - Friday, February 26, 2010 - link
Just thought I'd add a link to a couple of graphs i made of IOPS scaling as a function of Queue Depth for 1-4 x25-V in RAID 0 from ICH10R compared to x25-M 80GB and 160GB, and 2 x25-M 80GB RAID 0. These are in the same price range, and the graphs will show why i think Anands reviews don't show the whole truth when there is no test beyond QD 8.link: http://www.diskusjon.no/index.php?app=core&mod...">http://www.diskusjon.no/index.php?app=c...h_rel_mo...
The tests were done by 3 users at a forum i frequent, the username is in front of the setup that was benched.
The IOmeter config run was: 1GB testfile, 30 sec run, 2 sec ramp. Block sizes 0,5KB, 4KB, 16KB, 64KB. Queue Depths 1-128, 2^n stepping. This is a small part of a project from a month back mapping SSD and SSD RAID scaling by block size and queue depth (block sizes 0,5KB-64KB 2^n stepping, QD 1-128 2^n stepping).
ATTO is also nice to show scaling of sequential performance by block size (and possibly queue depth).
cditty - Friday, February 26, 2010 - link
Another great article. I have to give it to you, Anand. Your SSD coverage is by far the best on the net. I have learned so much from your various articles.