OCZ's Vertex 2 Pro Preview: The Fastest MLC SSD We've Ever Tested
by Anand Lal Shimpi on December 31, 2009 12:00 AM EST- Posted in
- Storage
AnandTech Storage Bench
I introduced our storage suite in our last SSD article and it’s back, now with more data :)
Of the MLC SSDs represented here, there’s just nothing faster than the SandForce based OCZ Vertex 2 Pro.
Intel’s SLC based X25-E actually does very well, especially for a controller that’s as old as it is. It is worth noting however that the only thing separating Intel from SandForce-level performance is the X25-M’s low sequential write speed...
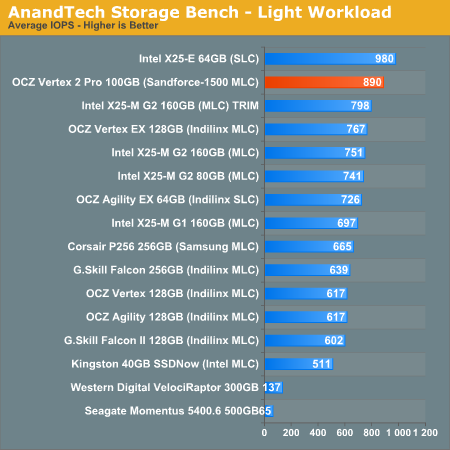
The first in our benchmark suite is a light usage case. The Windows 7 system is loaded with Firefox, Office 2007 and Adobe Reader among other applications. With Firefox we browse web pages like Facebook, AnandTech, Digg and other sites. Outlook is also running and we use it to check emails, create and send a message with a PDF attachment. Adobe Reader is used to view some PDFs. Excel 2007 is used to create a spreadsheet, graphs and save the document. The same goes for Word 2007. We open and step through a presentation in PowerPoint 2007 received as an email attachment before saving it to the desktop. Finally we watch a bit of a Firefly episode in Windows Media Player 11.
There’s some level of multitasking going on here but it’s not unreasonable by any means. Generally the application tasks proceed linearly, with the exception of things like web browsing which may happen in between one of the other tasks.
The recording is played back on all of our drives here today. Remember that we’re isolating disk performance, all we’re doing is playing back every single disk access that happened in that ~5 minute period of usage. The light workload is composed of 37,501 reads and 20,268 writes. Over 30% of the IOs are 4KB, 11% are 16KB, 22% are 32KB and approximately 13% are 64KB in size. Less than 30% of the operations are absolutely sequential in nature. Average queue depth is 6.09 IOs.
The performance results are reported in average I/O Operations per Second (IOPS):
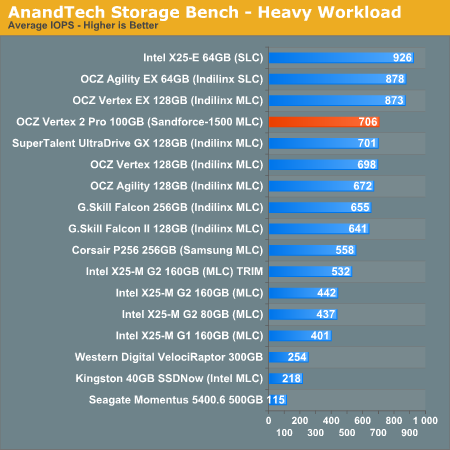
If there’s a light usage case there’s bound to be a heavy one. In this test we have Microsoft Security Essentials running in the background with real time virus scanning enabled. We also perform a quick scan in the middle of the test. Firefox, Outlook, Excel, Word and Powerpoint are all used the same as they were in the light test. We add Photoshop CS4 to the mix, opening a bunch of 12MP images, editing them, then saving them as highly compressed JPGs for web publishing. Windows 7’s picture viewer is used to view a bunch of pictures on the hard drive. We use 7-zip to create and extract .7z archives. Downloading is also prominently featured in our heavy test; we download large files from the Internet during portions of the benchmark, as well as use uTorrent to grab a couple of torrents. Some of the applications in use are installed during the benchmark, Windows updates are also installed. Towards the end of the test we launch World of Warcraft, play for a few minutes, then delete the folder. This test also takes into account all of the disk accesses that happen while the OS is booting.
The benchmark is 22 minutes long and it consists of 128,895 read operations and 72,411 write operations. Roughly 44% of all IOs were sequential. Approximately 30% of all accesses were 4KB in size, 12% were 16KB in size, 14% were 32KB and 20% were 64KB. Average queue depth was 3.59.
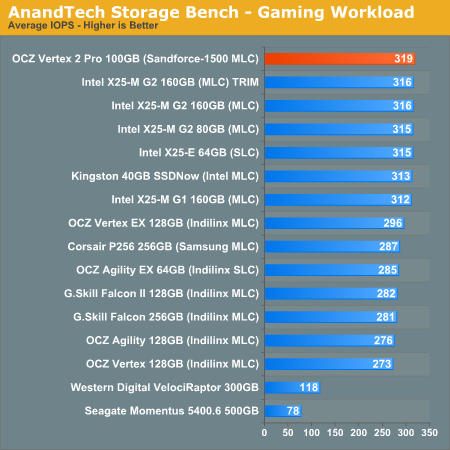
Our final test focuses on actual gameplay in four 3D games: World of Warcraft, Batman: Arkham Asylum, FarCry 2 and Risen, in that order. The games are launched and played, altogether for a total of just under 30 minutes. The benchmark measures game load time, level load time, disk accesses from save games and normal data streaming during gameplay.
The gaming workload is made up of 75,206 read operations and only 4,592 write operations. Only 20% of the accesses are 4KB in size, nearly 40% are 64KB and 20% are 32KB. A whopping 69% of the IOs are sequential, meaning this is predominantly a sequential read benchmark. The average queue depth is 7.76 IOs.


100 Comments
View All Comments
fertilizer - Tuesday, January 5, 2010 - link
First of all, my complements to a great article!It provided me with great insight!
It seems to me that SSD manufacturers are spending a lot of time complying to the world of HDD based Operating Systems.
Would'nt it be time to get OS's to treat a SSD differently than a HDD?
j718 - Tuesday, January 5, 2010 - link
the ocz vertex ex is an slc drive, not mlc as shown in the charts.j718 - Tuesday, January 5, 2010 - link
whoops, sorry, it's just the anandtech storage bench charts that have the ex mislabeled.Donald99 - Monday, January 4, 2010 - link
Any thoughts on potential energy use in mobile environment? Compared to intel MLC. Still better energy efficiencey than a traditional drive?Performance results seem uber.
cliffa3 - Monday, January 4, 2010 - link
Anand,Great article, will be an interesting technology to watch and see how mature it really is.
Question on the timeline for the price drop: When you said 'we'll see 160GB down at $225', were you talking about the mid-year refresh or the end of year next-gen?
MadMan007 - Monday, January 4, 2010 - link
Is it just me or is it inaccurate to mix GB and GiB when calculating overprovisioning at the bottom of page 5? By my reckoning the overprovisioning should be 6.6% (64GB/60GB, 128GB/120GB) not double that from using (64GB/55.9GiB etc)vol7ron - Monday, January 4, 2010 - link
Anand, the right column of the table should be marked as GiB.The last paragraph should take that into consideration. Either the second column should first be converted into GiB, or if it already is (and hard to believe it is), then you could do direct division from there.
The new table:
Adv.(GB) Tot.(GB) Tot.(GiB) User(GiB)
50 64 59.6 46.6
100 128 119.2 93.1
200 256 238.4 186.3
400 512 476.8 372.5
The new percentages should be:
(59.6-46.6) / 59.6 x 100 = 21.8% decrease
(119.2-93.1) / 119.2 x 100 = 21.9% decrease
(238.4-186.3) / 238.4 x 100 = 21.9% decrease
(476.8-372.5) / 476.8 x 100 = 21.9% decrease
And the second table:
Adv.(GB) Tot.(GB) Tot.(GiB) User(GiB)
60 64 59.6 55.9
120 128 119.2 111.8
240 256 238.4 223.5
480 512 476.8 447
The new percentages should be:
(59.6-55.9) / 59.6 x 100 = 6.21% decrease
(119.2-111.8) / 119.2 x 100 = 6.21% decrease
(238.4-223.5) / 238.4 x 100 = 6.25% decrease
(476.8-447) / 476.8 x 100 = 6.25% decrease
Note, I did not use significant figures, so all numbers are approximated, yet suitable - the theoretical value may be slightly different.
vol7ron
vol7ron - Monday, January 4, 2010 - link
Anand, the right column of the table should be marked as GiB.The last paragraph should take that into consideration. Either the second column should first be converted into GiB, or if it already is (and hard to believe it is), then you could do direct division from there.
The new table:
Adv.(GB) Tot.(GB) Tot.(GiB) User(GiB)
50 64 59.6 46.6
100 128 119.2 93.1
200 256 238.4 186.3
400 512 476.8 372.5
The new percentages should be:
(59.6-46.6) / 59.6 x 100 = 21.8% decrease
(119.2-93.1) / 119.2 x 100 = 21.9% decrease
(238.4-186.3) / 238.4 x 100 = 21.9% decrease
(476.8-372.5) / 476.8 x 100 = 21.9% decrease
And the second table:
Adv.(GB) Tot.(GB) Tot.(GiB) User(GiB)
60 64 59.6 55.9
120 128 119.2 111.8
240 256 238.4 223.5
480 512 476.8 447
The new percentages should be:
(59.6-55.9) / 59.6 x 100 = 6.21% decrease
(119.2-111.8) / 119.2 x 100 = 6.21% decrease
(238.4-223.5) / 238.4 x 100 = 6.25% decrease
(476.8-447) / 476.8 x 100 = 6.25% decrease
Note, I did not use significant figures, so all numbers are approximated, yet suitable - the theoretical value may be slightly different.
vol7ron
Guspaz - Sunday, January 3, 2010 - link
Your pricing estimates for Intel's refreshes worry me, and I worry that you're out of touch with SSD pricing.Intel's G2 x25-m 160GB drive currently sells for $500-550, so claims that Intel will be selling 600GB drives at the same price point raise some eyebrows.
kunedog - Monday, January 4, 2010 - link
I couldn't help but roll my eyes a little when I saw that Anand was again making Intel SSD pricing predictions. Even the G1 X-25Ms skyrocketed above his predictions for the G2s:http://www.anandtech.com/storage/showdoc.aspx?i=36...">http://www.anandtech.com/storage/showdoc.aspx?i=36...
And the G1s are still higher at Newegg (the G2s are still a LOT higher). Anand has never acknowledged the stratospheric X-25M G2 pricing and how dead wrong his predictions were. He's kept us updated on negative aspects like the firmware bugs, slow stock/availability of G2s, and lack of TRIM for G1s, but never pricing.