Seagate Barracuda XT 2TB: SATA 6Gb/s Performance Preview
by Gary Key on October 29, 2009 12:00 AM EST- Posted in
- Storage
AnandTech Storage Bench Results –
Finding good, real world, storage benchmarks is next to impossible. The synthetic tests work up to a certain point but you need real world examples. Measuring performance in individual applications often ends up with charts like these where all of the drives perform identically. Benchmark suites like PCMark Vantage are the best we can do, but they are a bit too easy on these drives in my opinion and while representative of a real world environment, they aren’t necessarily representative of all real world environments.
Recently we’ve been able to get our hands on a piece of software that allows us to record all disk activity on a machine and then play it back on any other machine. The point is that we can now model a real world usage scenario without waiting for BAPCo or Futuremark to do it for us. The performance results are reported in I/O Operations per Second (IOPS).
The first in our new benchmark suite is a light usage application case. The Windows 7 system is loaded with Firefox, Office 2007 and Adobe Reader among other applications. With Firefox we browse web pages like Facebook, AnandTech, Digg and other sites. Outlook is also running and we use it to check emails, create and send a message with a PDF attachment. Adobe Reader is used to view some PDFs. Excel 2007 is used to create a spreadsheet, graphs and save the document. The same goes for Word 2007. We open and step through a presentation in PowerPoint 2007 received as an email attachment before saving it to the desktop. Finally we watch a bit of a Firefly episode in Windows Media Player 11.
There’s some level of multitasking going on here but it’s not unreasonable by any means. Generally the application tasks proceed linearly, with the exception of things like web browsing which may happen in between one of the other tasks.
The recording is played back on all of our drives here today. Remember that we’re isolating disk performance; all we’re doing is playing back every single disk access that happened in that ~5 minute period of usage. The light trace is composed of 37,501 reads and 20,268 writes. Over 30% of the IOs are 4KB, 11% are 16KB, 22% are 32KB and approximately 13% are 64KB in size. Less than 30% of the operations are absolutely sequential in nature. Average queue depth is 6.09 IOs.
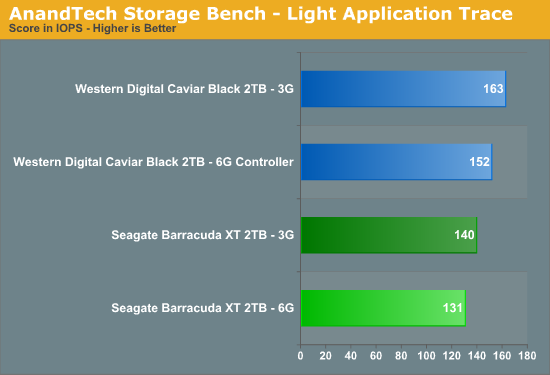
The Marvell controller is 7% slower than the Intel controller with the WD drive and once again 7% with the Seagate drive. The WD drive is up to 24% faster than the Seagate drive depending on the controller configuration.
If there’s a light usage case there’s bound to be a heavy one. In this test we have Microsoft Security Essentials running in the background with real time virus scanning enabled. We also perform a quick scan in the middle of the test. Firefox, Outlook, Excel, Word and Powerpoint are all used the same as they were in the light test. We add Photoshop CS4 to the mix, opening a bunch of 12MP images, editing them, then saving them as highly compressed JPGs for web publishing. Windows 7’s picture viewer is used to view a bunch of pictures on the hard drive.
We then use 7-zip to create and extract .7z archives. Downloading is also prominently featured in our heavy test; we download large files from the Internet during portions of the benchmark, as well as use uTorrent to grab a couple of torrents. Some of the applications in use are installed during the benchmark, Windows updates are also installed. Towards the end of the test we launch World of Warcraft, play for a few minutes, then delete the folder. This test also takes into account all of the disk accesses that happen while the OS is booting.
The benchmark is 22 minutes long and it consists of 128,895 read operations and 72,411 write operations. Roughly 44% of all IOs were sequential. Approximately 30% of all accesses were 4KB in size, 12% were 16KB in size, 14% were 32KB and 20% were 64KB. Average queue depth was 3.59.
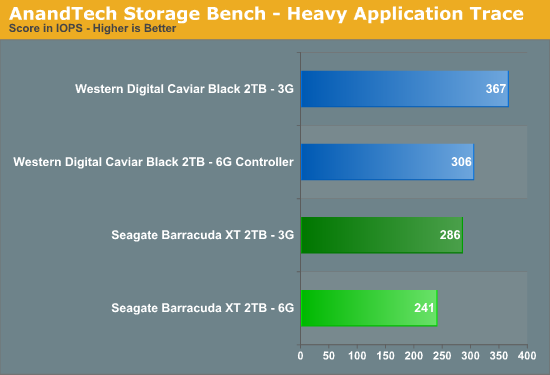
The Marvell controller is 19% slower than the Intel controller with the WD drive and 18% with the Seagate drive. The WD drive is up to 28% faster than the Seagate drive.
Our final test focuses on actual gameplay in four 3D games: World of Warcraft, Batman: Arkham Asylum, FarCry 2 and Risen, in that order. The games are launched and played, altogether for a total of just under 30 minutes. The benchmark measures game load time, level load time, disk accesses from saved games and normal data streaming during game play.
The gaming trace is made up of 75,206 read operations and only 4,592 write operations. Only 20% of the accesses are 4KB in size, nearly 40% are 64KB and 20% are 32KB. A whopping 69% of the IOs are sequential, meaning this is predominantly a sequential read benchmark. The average queue depth is 7.76 IOs.
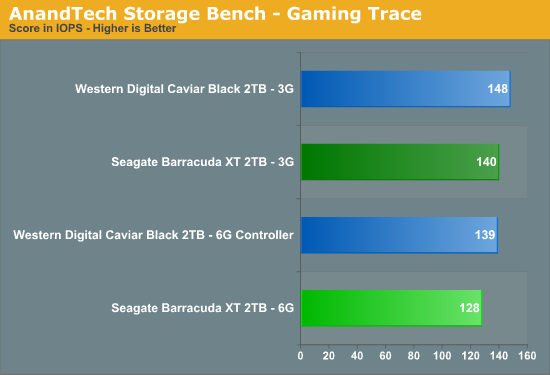
Not much else to say here, the Marvell controller is 6% slower than the Intel controller with the WD drive and 9% with the Seagate drive. The WD drive is up to 8% faster than the Seagate drive.


55 Comments
View All Comments
HangFire - Thursday, October 29, 2009 - link
This is what I expected- there is no real need for 6Gb/S SATA.SAS, on the other hand, which (for lower speeds, at least) uses the same connector technology, has a real need for 6Gb/S, since there is typically a RAID on the other end of the SAS cable.
Unfortunately, I didn't see even a passing mention of when, or if, this technology is coming to SAS.
7Enigma - Thursday, October 29, 2009 - link
Anand,Did you get your 3G and 6G mixed up? If not your first 2 charts showing your custom HD tests show the 6G 15-20% slower than the 3G. Your commentary doesn't say anything about the 3G/6G comparison, only the differences between the brands...
7Enigma - Thursday, October 29, 2009 - link
Yikes, I completely misread your comments. That's what I get for posting before double-checking. Please disregard my initial post!Pastuch - Thursday, October 29, 2009 - link
2TB Performance? Who cares... Give us more Anand Home Theater blogs! Now those are interesting!All we really want to know is if these new Seagates are more reliable than the Seagate 7200.11s or the WD Greens. In fact if you look at all of the drives over 1TB there are VERY FEW that are reliable.
The HD manufacturers need to forget 2tb and move to 4tb drives asap. My blu-ray backups already take up 5 Terabytes and it's growing exponentially.
If we wanted HD performance we'd be reading your SSD articles ;)
falc0ne - Thursday, November 5, 2009 - link
bluray backups...maaan are u nuts? :))this is an example with:"don't do this at home" :))
Woa you should have seen my 'weddings' bluray movie backup: it takes 2000TB maan i've attended to many weddings:)
Second thoughts: seriously thinking in asking IBM or Google to host my backups:))
JEDIYoda - Friday, October 30, 2009 - link
We all care about 2T performance nice review. Thanks for touching on things we all care about!!Nobody gives a fuck about 4T drives especially when only one person is crying like a weenie. Especially when that weenie is so misinformed about the reliability of drives ovcer 1T!!!
Muahahaha
kmmatney - Thursday, October 29, 2009 - link
"All we really want to know is if these new Seagates are more reliable than the Seagate 7200.11s or the WD Greens. In fact if you look at all of the drives over 1TB there are VERY FEW that are reliable."Exactly. The only thing that is really important with these large drives is how reliable they are. Youc an't really inlcude that in a review of a new product, but really this is way more important than all the other benchmarks. These drives are used for backup and storage and need to be reliable.
Gholam - Monday, November 2, 2009 - link
I don't really care about individual drive reliability. There is no drive that is 100% reliable, and as long as you take proper precautions, drive failures are inconsequential.SunSamurai - Thursday, October 29, 2009 - link
SIlly person, dont you see where the true potential of these lay?I would order 1000 of these for a server farm based on the simple fact that in the tests they are taking -1% CPU time. Over 1000 of these drives thats 10x cpu performance! =D
atlmann10 - Friday, October 30, 2009 - link
Wow Silly person that's an insult. Well Mr name caller, I would let you know that if you bought 1000 of these and ran your sever farm on SSD drives specifically, especially watching for upgrades in SSD tech you would be loosing. The SSD debate is over anyway now, as Intel said today that SSD drives could not diminish in nand size past 22nm today. What this means is that if it is at 32nm and we go by there tick/tock theory, and we also look at how fast this technology has been moving is, you would have no more than a year and a half max on your time line. After that there will be no greater Nand flash drives. So your server farm would die in a year and a half. I imagine you would recognize a return on your investment in 2-3 years. So if your giving away money I'll send you my address.