The Best Server CPUs part 2: the Intel "Nehalem" Xeon X5570
by Johan De Gelas on March 30, 2009 3:00 PM EST- Posted in
- IT Computing
| OLTP: Oracle Charbench "Calling Circle" | |
| Operating System | Windows 2008 Enterprise RTM (64-bit) |
| Software | Oracle 10g Release 2 (10.2) for 64-bit Windows |
| Benchmark software | Swingbench/Charbench 2.2 |
| Database Size | 9 GB |
| Typical error margin | 2-2.5% |
In our last review, we included our first Oracle benchmark. In this review, we are happy to announce that we finally tamed the Oracle beast … somewhat. The first benchmark we tried (see our AMD Opteron 8384 2.7GHz review) was "Order Entry", but this benchmark is designed for Oracle Real Application Clusters and right now we could not make it scale above eight cores. Even the gains from four to eight cores were pretty small, despite many experiments (increasing the number of users and so on). With Calling Circle, we increased the database size to 9.5GB to make sure that once again locking contention was not completely killing off multi-core performance. To reduce the pressure on our humble storage system, we increased the SGA size (Oracle buffer in RAM) to 10GB and the PGA size was set at 1.6GB. A calling circle test consists of 83% selects, 7% inserts, and 10% updates.
The "calling circle" test runs for 10 minutes. The test is repeated six times and the results of the first run are discarded. The reason for discarding the first run is that the disk queue length is sometimes close to 1, while the second run and later have a DQL of 0.2 or lower. In this case it was rather easy to run the CPUs at 99% load. All configurations below are dual CPUs.
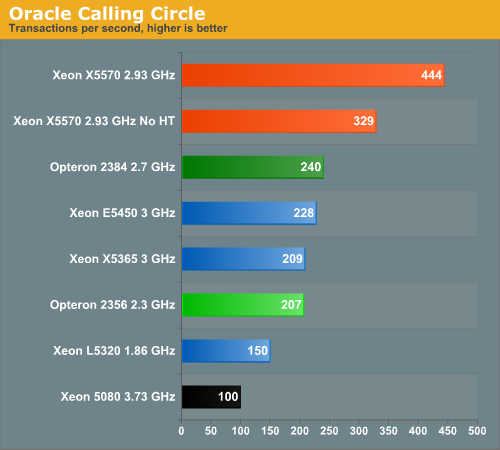
We have seen this picture before: the latest Opteron has no problem with leaving the older generations of Xeons behind. However, the newest Xeon is simply running circles around the rest of the pack. It is a mind blowing 95% faster than the Xeon 5472 and 85% than the Opteron 8384 2.7GHz. SMT is formidable weapon, as Oracle makes good use of the extra threads, and it provides a 35% performance increase.


44 Comments
View All Comments
snakeoil - Monday, March 30, 2009 - link
oops it seems that hypertreading is not scaling very well too bad for inteleva2000 - Tuesday, March 31, 2009 - link
Bloody awesome results for the new 55xx series. Can't wait to see some of the larger vBulletin forums online benefiting from these monsters :)ssj4Gogeta - Monday, March 30, 2009 - link
huh?ltcommanderdata - Monday, March 30, 2009 - link
I was wondering if you got any feeling whether Hyperthreading scaled better on Nehalem than Netburst? And if so, do you think this is due to improvements made to HT itself in Nehalem, just do to Nehalem 4+1 instruction decoders and more execution units or because software is better optimized for multithreading/hyperthreading now? Maybe I'm thinking mostly desktop, but HT had kind of a hit or miss reputation in Netburst, and it'd be interesting to see if it just came before it's time.TA152H - Monday, March 30, 2009 - link
Well, for one, the Nehalem is wider than the Pentium 4, so that's a big issue there. On the negative side (with respect to HT increase, but really a positive) you have better scheduling with Nehalem, in particular, memory disambiguation. The weaker the scheduler, the better the performance increase from HT, in general.I'd say it's both. Clearly, the width of Nehalem would help a lot more than the minor tweaks. Also, you have better memory bandwidth, and in particular, a large L1 cache. I have to believe it was fairly difficult for the Pentium 4 to keep feeding two threads with such a small L1 cache, and then you have the additional L2 latency vis-a-vis the Nehalem.
So, clearly the Nehalem is much better designed for it, and I think it's equally clear software has adjusted to the reality of more computers having multiple processors.
On top of this, these are server applications they are running, not mainstream desktop apps, which might show a different profile with regards to Hyper-threading improvements.
It would have to be a combination.
JohanAnandtech - Monday, March 30, 2009 - link
The L1-cache and the way that the Pentium 4 decoded was an important (maybe even the most important) factor in the mediocre SMT performance. Whenever the trace cache missed (and it was quite small, something of the equivalent of 16 KB), the Pentium 4 had only one real decoder. This means that you have to feed two threads with one decoder. In other words, whenever you get a miss in the trace cache, HT did more bad than good in the Pentium 4. That is clearly is not the case in Nehalem with excellent decoding capabilities and larger L1.And I fully agree with your comments, although I don't think mem disambiguation has a huge impact on the "usefullness" of SMT. After all, there are lots of reasons why the ample execution resources are not fully used: branches, L2-cache misses etc.
IntelUser2000 - Tuesday, March 31, 2009 - link
Not only that, Pentium 4 had the Replay feature to try to make up for having such a long pipeline stage architecture. When Replay went wrong, it would use resources that would be hindering the 2nd thread.Core uarch has no such weaknesses.
SilentSin - Monday, March 30, 2009 - link
Wow...that's just ridiculous how much improvement was made, gg Intel. Can't wait to see how the 8-core EX's do, if this launch is any indication that will change the server landscape overnight.However, one thing I would like to see compared, or slightly modified, is the power consumption figures. Instead of an average amount of power used at idle or load, how about a total consumption figure over the length of a fixed benchmark (ie- how much power was used while running SPECint). I think that would be a good metric to illustrate very plainly how much power is saved from the greater performance with a given load. I saw the chart in the power/performance improvement on the Bottom Line page but it's not quite as digestible as or as easy to compare as a straight kW per benchmark figure would be. Perhaps give it the same time range as the slowest competing part completes the benchmark in. This would give you the ability to make a conclusion like "In the same amount of time the Opteron 8384 used to complete this benchmark, the 5570 used x watts less, and spent x seconds in idle". Since servers are rarely at 100% load at all times it would be nice to see how much faster it is and how much power it is using once it does get something to chew on.
Anyway, as usual that was an extremely well done write up, covered mostly everything I wanted to see.
7Enigma - Wednesday, April 1, 2009 - link
I think that is a very good method for determining total power consumption. Obviously this doesn't show cpu power consumption, but more importantly the overall consumption for a given unit of work.Nice thinking.
JohanAnandtech - Wednesday, April 1, 2009 - link
I am trying to hard, but I do not see the difference with our power numbers. This is the average power consumption of one CPU during 10 minutes of DVD-store OLTP activity. As readers have the performance numbers, you can perfectly calculate performance/watt or per KWh. Per server would be even better (instead of per CPU) but our servers were too different.Or am I missing something?