Overclocking Intel's New 45nm QX9650: The Rules Have Changed
by Kris Boughton on December 19, 2007 2:00 AM EST- Posted in
- CPUs
Will the Real QX9650 Power Consumption Please Stand Up?
The recent attention highlighting the conflicting manners in which Intel and AMD quote processor power consumption figures has generated a fair amount of discussion regarding which methodology more closely represents the truth. In reality, we can see the merits of both systems, and which one is more valuable to the consumer is largely a matter of personal perception.
To this day Intel still provides processor TDP (thermal design power) specifications with a single purpose in mind - ensuring thermal engineers have the information they need to do their jobs. Intel knows companies providing platforms based on their products must be able to design and manufacture cooling solutions capable of dissipating the installed processor's maximum heat production - all without violating temperature limits. Designing around these worst-case values ensures the system remains stable under all computing conditions.
AMD's focus is very different, as they have decided to use this data as a marketing tool. By drawing attention to the processor APC (average power consumption), they hope to appeal to businesses looking to lower costs associated with their data infrastructure's operation. Although most end users find little reason to concern themselves with the relatively small monthly savings that can come from a single system's lowered power consumption, this can be a significant sum of money for corporations supporting hundreds or even thousands of workstations. Then again, any business supporting thousands of computers usually has other concerns. Do they worry more about the $5,000-$10,000 per month (or more) spent on the employee using a workstation, or the $10-$30 spent on the power for the workstation? The greater concern is often whether or not a given location has the capacity to power the workstations, not how much the power will cost.
With that said, we would argue that AMD is pandering to the public while Intel has chosen to support the industry developers. We can all certainly agree though: no matter which method you believe is more correct, quoted numbers are useless without a consistent means for calculation.
Surprisingly, Intel has chosen to leave the QX9650's TDP unchanged from the 65nm QX6850's given value of 130W. This is a little confusing as reports from Intel on 45nm process technology improvements provide us with claims of switching energy efficiency increases of up to 30% and a reduction in transistor gate leakages of 10x or more. Could basic core performance improvements such as the incorporation of the new SSE4 instruction set have made such a difference in overall CPU efficiency? We think not. Obviously, there is something more going on here; either the QX6850 TDP is vastly under-rated or the QX9650 is much better than suggested. Perhaps over-rating the QX9650's TDP gives Intel the option in claiming further thermal improvements later. We will share the method we used in calculating a more representative TDP rating for our 45nm quad-core in a moment, but we found the value to be closer to 100W - some 30W less than the figure provided by the blue team, and right in line with the 30% energy efficiency increase.
Determining just how much power a particular processor consumes at a given operating frequency is more difficult than one might originally think. A few different methods exist for estimating these values - one requires nothing more that the processor's specified TDP and then scales this value based on a given overclocked core frequency and voltage. This isn't going to cut it for us, especially considering this technique insists we place full faith in Intel's quoted QX9650 TDP, a number we know to be sometimes unrepresentative of actual operating conditions. Instead, we decided to get creative and develop our own method. The concept is rather simple: we will measure the power draw from the wall, subtract off power consumption for "static" components, correct for PSU efficiency, and then devise a means for determining what portion of the remaining power the CPU consumes - by somehow attributing the remainder to "everything else." The biggest challenge will be devising a means for accurately determining where to place this final split.
Choosing the right PSU is vital in the success of our mission, and employing the services of a Corsair unit means we can take advantage of the published efficiency curves. Monitoring and recording total system power draw is easy thanks to our Kill-A-Watt from P3 International. Finally, calculating just how much power is used by static loads (fans, pumps, HDDs, etc.) won't be too hard at all - simply noting the power draw before and after disconnecting the load is quick and effective. Indeed, developing a method for subtracting off power consumed by the motherboard, memory, and graphics card is going to require the most thought.
Our approach is rather unique: we vary CPU frequency and voltage and then plot the base system load delta versus frequency. System load delta is the difference between wall power minus static loads at CPU full load and wall power minus static loads at idle - both corrected for PSU efficiency. Graphing the delta means that the plotted power varies solely as a function of CPU speed. Our immediate results generate the following graph.

Base System Power Delta (W) versus Processor Frequency (GHz)
Extending the curve downwards allows us to extrapolate our plot's predicted y-intercept. Mathematically, this point represents the frequency in which CPU full load power minus idle power is zero (CPU idle power equals CPU full power). Logic suggests that as the CPU full load power approaches zero so will idle power, especially considering idle power should always be less than the full load power. Without much argument, we find ourselves accepting this as our CPU minimum energy frequency (about 240MHz).
We then plot the base system idle power (wall power minus static loads at idle, again corrected for PSU efficiency) versus the same set of frequencies. Creating a best-fit equation and solving for power using the minimum energy frequency found in the previous graph above gives us the base system power consumption with the CPU at its minimum energy (near zero). This is as close we are going to come to quantitatively determining the idle power consumption of the motherboard, memory, and graphics card combined. We calculated a value of 110W using an ASUS P5E3, 4GB of OCZ DDR3, and a single 8800 Ultra resting comfortably at 500Mhz on a 2D desktop. More likely than not the power-hungry GPU and overclocked X38 chipset make up the lion's share of this value.
With this number our goal is in sight - subtracting this value from the corrected base system idle values used in the creation of our second graph (not shown) gives us the CPU idle power points. Adding to these the base system load deltas plotted in the figure above provides us with the final unknowns - actual CPU full load power values. Joining these two sets of data points gives us the data below.
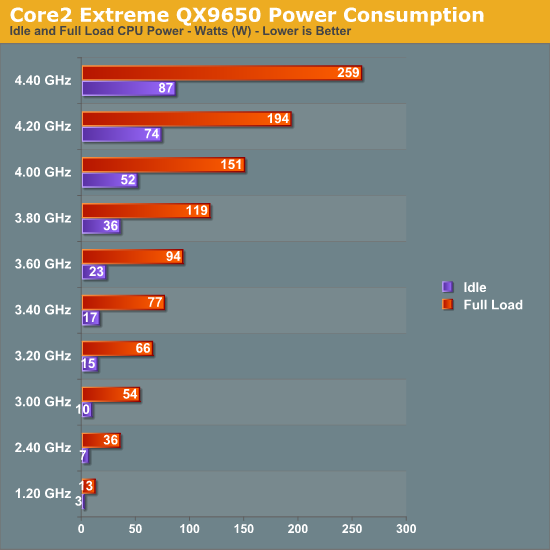
This graph rewards our hard work by providing us with a wealth of knowledge. Although the values above are highly precise only when referring to our particular QX9650 (every CPU is a little different), the accuracy of our method should be very good. The first thing we notice is how full load power consumption quickly increases to almost uncontrollable levels when pushing above ~4.25GHz. In fact, we found achieving true stability any higher nearly impossible with water-cooling alone. Users who are familiar with overclocking will recognize this trend: a CPU usually scales extremely well up to a certain point, beyond which any further overclocking requires an excessive amount of additional voltage. This is normal and exactly where this point lies is a function of cooling and silicon limits (i.e. process technology) and in reality has very little to do with luck.
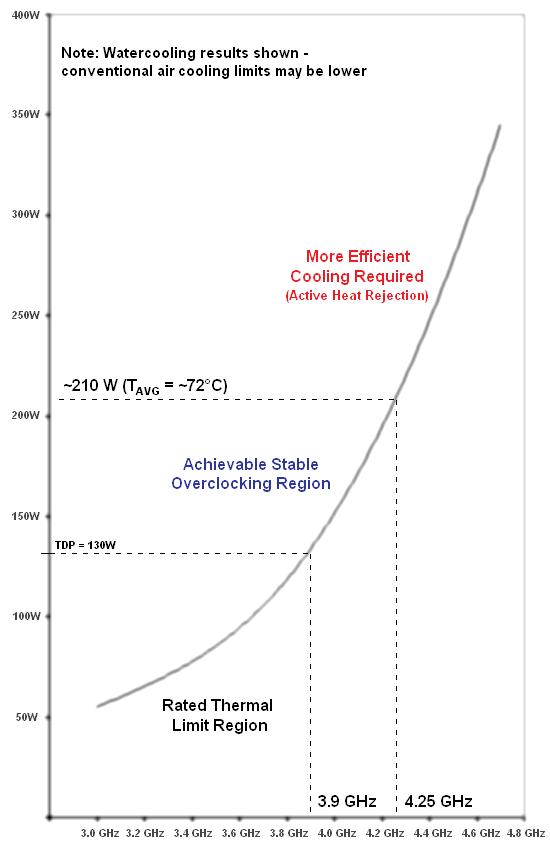
An example of the findings that can be developed by measuring system response
We made this last graph using our CPU full load power consumption/frequency pair data points from the figure above. Based on our examinations, just about every Core 2 Extreme QX9650 owner should have little trouble accomplishing at least a 3.9GHz overclock. Upgrading the cooling used will at best provide modest improvements as these quad-cores begin to generate a lot of heat when pushed much further.


56 Comments
View All Comments
Kougar - Thursday, December 20, 2007 - link
This was the exact type of article I love to sit down and read through. It doesn't matter if portions of it are above my head, it just gets me to rise up another level to grab at them. Your article was a great read and I very much hope to see many more like this one in the future!Regarding the P5E3, I am somewhat surprised that 0.81v was the lowest you could set. Even the budget board P31-DS3L offers 0.51v as an option, my personal P35-DQ6 has 0.50v as a vCore option. I found your commentary regarding Load Line Calibration to be illuminating... this is exactly what enthusiasts like myself and others need to know.
Lastly, I hate to ask here but Google was no help, Intel's ARK database didn't cover it, and Intel's datasheet didn't mention that I could see... what exactly is P35's process size and default vCore? The same as X38's...? As much as I love Gigabyte they are notorious for their lack of system voltage info...
kjboughton - Thursday, December 20, 2007 - link
The P35 and X38 chipsets are both made using Intel's standard 90nm process technology. It's not uncommon for chipset's to lag behind current CPU offerings by a whole process generation or more. With that being said, Intel's upcoming P45 chipset, the last of it's kind (recall that all future CPU technologies will make use of an onboard memory controllers) will be made on the 65nm process -- something even the X48 won't have. In fact, this reduction in process size may have considerable benefits for P45 when it comes to the reduction in power consumption and increased performance headroom, particularlly when overclocking. The P45 default Vmch is 1.15V, X38 is slightly higer at 1.25V. Based on this I would expect to see the P45 come in around 1.05V or possibly even lower.myocardia - Thursday, December 20, 2007 - link
Kris, great article. But, when did $400-500 worth of watercooling equipment become so commonplace, as to be putting the one (or is that two?) companies who make phase-change units out of business? If freon is no longer needed for extreme CPU cooling, couldn't Vapochill just start making even more expensive, higher-end watercooling?spamme33 - Thursday, December 20, 2007 - link
I have been overclocking since my first computer build years and years ago, rarely do I learn that much from one article. Very well written, informative, and timely!kilkennycat - Thursday, December 20, 2007 - link
The documentation accompanying the BIOS settings of almost all enthusiast motherboards is frequently obscure and incomplete - probably because it is printed many months before the board/BIOS is released, plus the leading manufacturers never bother to update BIOS user-documentation when they update the BIOS. Also, it does seem that the documentation authors have a uniformly poor grasp of the English language and prefer to keep descriptions of all BIOS settings as vague and incomprehensible as possible. It is also so common to find sundry BIOS entries not documented AT ALL anywhere in the motherboard manual, even the (so-called) latest on-line version.So I have a request on behalf of those like myself desperately trying to understand each entry in the BIOS of that brand-new and very expensive enthusiastic motherboard that I have just purchased, with that abysmal so-called user-manual and pathetic in-BIOS "Help" Function-key :-
Would it be possible for you or other at Anandtech to fully document/explain all the terms used in the text of the CPU and memory BIOS settings of the most popular enthusiast motherboards?
To keep such an exercise manageable, I suggest confining the exercise initially to existing and upcoming enthusiast desktop motherboards that are fully compatible with Penryn and Phenom. At present, X48, nVidia 780i, AMD 790FX.....
poohbear - Thursday, December 20, 2007 - link
thank you very much for such an informative and detailed article. very much appreciated for us overclockers and the future looks fantabulous w/ these cpus.wyemarn - Thursday, December 20, 2007 - link
Thank you very much for this great article. What a wonderful Christmas gift from Anandtech! This is one the most complete article I have ever read. CPU performance, overclocking, mobo settings, power consumption all in one article. What a joy to read.akaevile - Thursday, December 20, 2007 - link
Thank you for the detailed information. One has to be a little nervous however for the implications in what your work has found. Will Intel's improvements in refining 45nm technology push the line or has it been drawn in the sand??n7 - Wednesday, December 19, 2007 - link
Really superb article.Possibly the best i've ever seen on AT!
Thanx for the indepth info!
Bozo Galora - Wednesday, December 19, 2007 - link
looks like not only the X48, but three 45nm quads also will be delayed - due to AMD incompetence.http://www.digitimes.com/mobos/a20071218PD212.html">http://www.digitimes.com/mobos/a20071218PD212.html