Hitachi Deskstar 7K1000: Terabyte Storage arrives on the Desktop
by Gary Key on March 19, 2007 8:00 AM EST- Posted in
- Storage
Hard Disk Performance: HD Tune
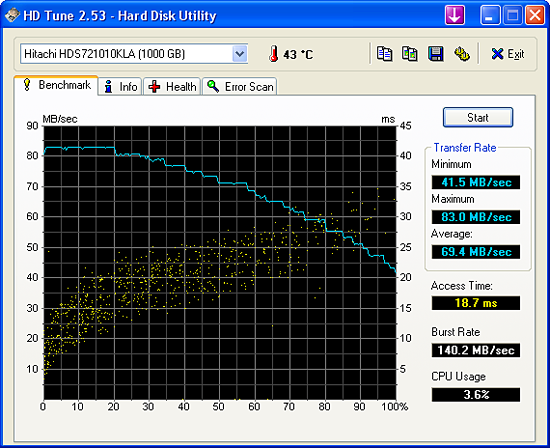
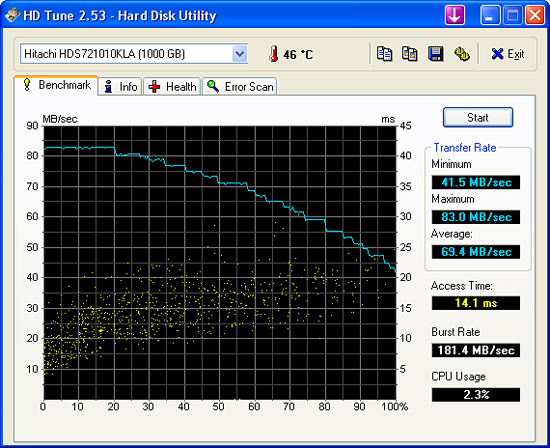
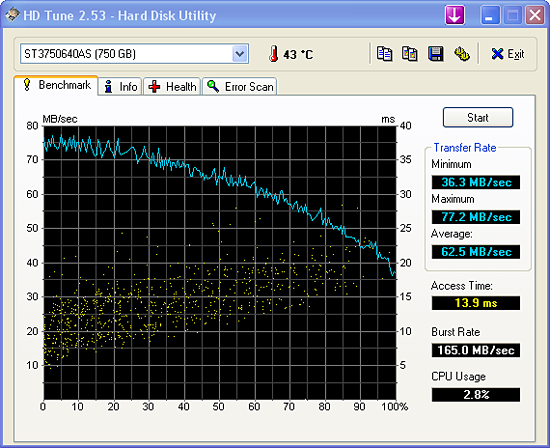
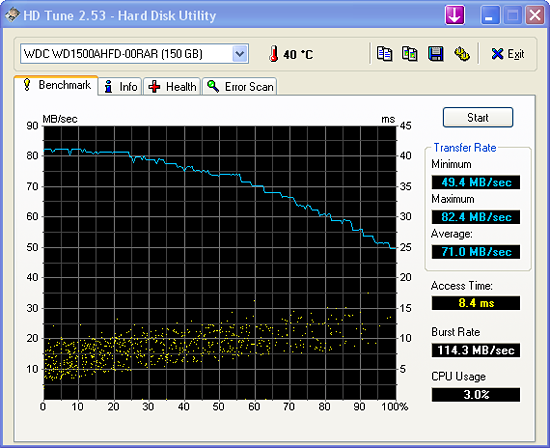
The Hitachi Deskstar 7K1000 has the second highest overall sustained transfer rates of the three drives listed. The sustained transfer rate is nipping on the heels of the WD1500AHFD in this test while the maximum transfer rate is slightly ahead and the minimum results are about 17% slower. Our first screenshot is the Hitachi drive with Automatic Acoustic Management and NCQ turned on. The second screenshot has both features turned off. We also tested with AAM off and NCQ on with the burst rate results mirroring the first screenshot and the access time mirroring the second screenshot. This means that NCQ being turned off is what affected burst transfer rates and AAM being on increased the access times in these synthetic tests.
We did not expect this as previous test results with several drives showed that AAM usually caused a performance penalty in both transfer and access time rates. In our application tests we found that enabling AAM usually did not alter the test results more than 1% and at times the scores were even or slightly better (other than the lower access times). Even though the 7K1000 drive has excellent sustained transfer rates we will soon see this does not always translate into class leading performance.
Hard Disk Performance: HD Tach
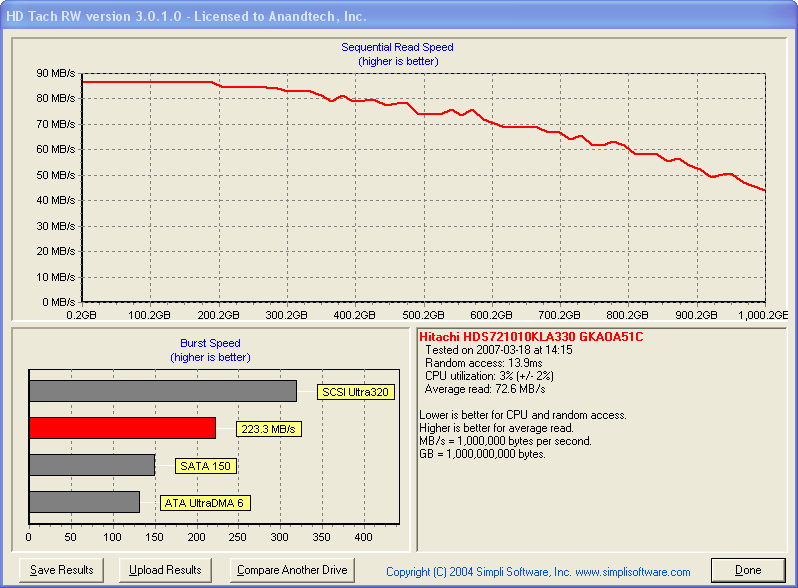
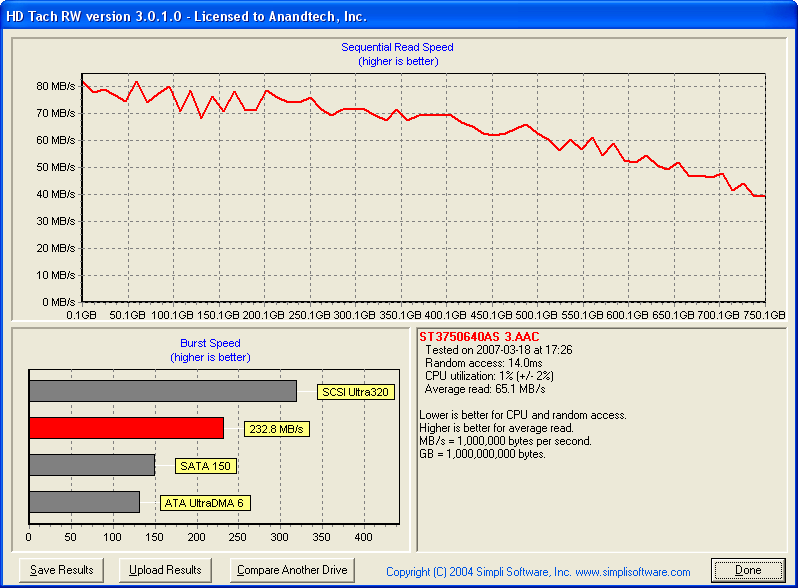
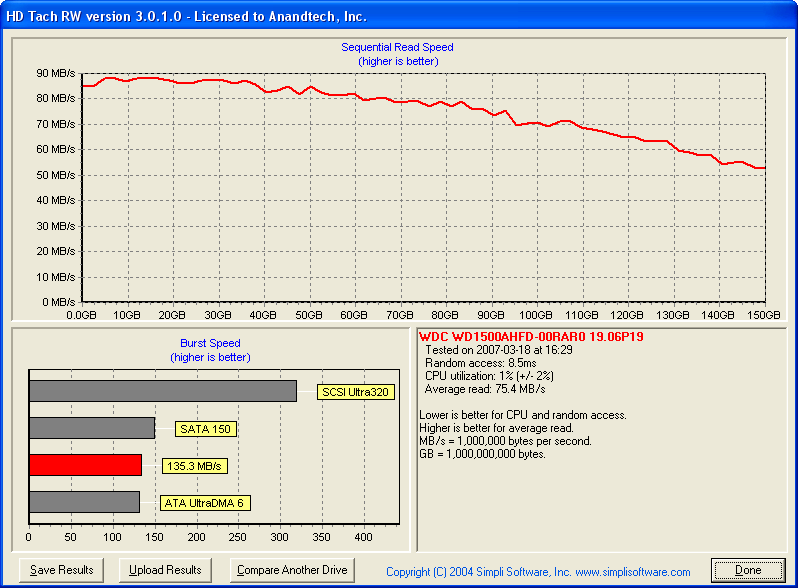
We are also including HD Tach results for each drive. Once again the first screenshot has the 7K1000 test score with AAM and NCQ turned on while the second screenshot is with both options turned off. Our tests with AAM turned off and NCQ on resulted in scores nearly identical to the HD Tune results indicating once again that AAM does not inflict a noticeable performance penalty on this drive. The balance of the performance results between our test samples basically mirrors those of our HD Tune scores.
The Hitachi Deskstar 7K1000 has the second highest overall sustained transfer rates of the three drives listed. The sustained transfer rate is nipping on the heels of the WD1500AHFD in this test while the maximum transfer rate is slightly ahead and the minimum results are about 17% slower. Our first screenshot is the Hitachi drive with Automatic Acoustic Management and NCQ turned on. The second screenshot has both features turned off. We also tested with AAM off and NCQ on with the burst rate results mirroring the first screenshot and the access time mirroring the second screenshot. This means that NCQ being turned off is what affected burst transfer rates and AAM being on increased the access times in these synthetic tests.
We did not expect this as previous test results with several drives showed that AAM usually caused a performance penalty in both transfer and access time rates. In our application tests we found that enabling AAM usually did not alter the test results more than 1% and at times the scores were even or slightly better (other than the lower access times). Even though the 7K1000 drive has excellent sustained transfer rates we will soon see this does not always translate into class leading performance.
Hard Disk Performance: HD Tach
 |
 |
 |
 |
| Click to enlarge |
We are also including HD Tach results for each drive. Once again the first screenshot has the 7K1000 test score with AAM and NCQ turned on while the second screenshot is with both options turned off. Our tests with AAM turned off and NCQ on resulted in scores nearly identical to the HD Tune results indicating once again that AAM does not inflict a noticeable performance penalty on this drive. The balance of the performance results between our test samples basically mirrors those of our HD Tune scores.


74 Comments
View All Comments
goldfish2 - Tuesday, March 20, 2007 - link
just noticed a problem you may wish to address with your charts, hope this hasn't already been mentioned.Take a look at the chart 'video application timing - time to transcode DVD'
Your times are in Minutes/seconds, it seems you're chart application has interpreted the numbers as decimals, and made the bar lengths on this basis. Take a look at the bar for WD5000YS 500GB. It says 4.59; I assume this means 4 minutes 59 seconds, making the WD740GD 2 seconds slower at 5 minutes 1 second. But the bar lengths are scaled for decimal, so that the bar on the WD740GD is much longer. You'll have to see if you can get your graph package to think in minutes:seconds, or have the bar lengths entered in decimal (i.e. 4:30 seconds becomes 4.5 minutes) and put a label on in minutes for readability.
Thanks for the review though.
Gary Key - Tuesday, March 20, 2007 - link
We have a short blurb under the Application Performance section -"Our application benchmarks are designed to show application performance results with times being reported in minutes / seconds or seconds only, with lower scores being better. Our graph engine does not allow for a time format such a 1:05 (one minute, five seconds) so this time value will be represented as 1.05."
We know this is an issue and hopefully we can address it in our next engine update (coming soon from what I understand). I had used percentage values in a previous article that was also confusing to some degree. Thanks for the comments and they have been passed on to our web team. ;)
PrinceGaz - Tuesday, March 20, 2007 - link
The simplest and most logical solution is just to enter the time in seconds, rather than minutes and seconds; even if graphed correctly, comparing values composed of two units (minutes:seconds) is difficult compared to a single unit (seconds).If two results were 6:47 and 7:04 for instance, the difference betweem them is much clearer if you say 407 and 424 seconds. By giving the value in seconds only, you can see at a glance that there is a 17 second difference, which translates to just over 4% (17 divided by 407/100, or 17 divided by about 4.1).
Doing the same mental calculation with 6:47 and 7:04 first involves working out the difference with the extra step of dealing with 60 seconds to a minute. Then you have a difference of 17 seconds out of a little under 7 minutes, which isn't very helpful until you convert the 7 minutes to seconds, as it should have been originally.
That's my opinion anyway.
JarredWalton - Tuesday, March 20, 2007 - link
Hi Gary. I told you so! Damned if you do, damned if you don't. ;) (The rest of you can just ignore me.)PrinceGaz - Tuesday, March 20, 2007 - link
How can you say only two years?
The 14 years you say it took to increase from 1GB to 500GB represents a doubling of capacity nine times, or roughly 1.56 years (19 months) for the capacity to double. That means that the two years (actually 20 months as Hitachi released a 500GB drive in Jul 2005) it took to double again, from 500GB to 1TB is actually marginally longer than average.
It would be more accurate to say that the trend of capacities doubling roughly every 18 months is continuing.
patentman - Tuesday, March 20, 2007 - link
The two year remark is two years from the first commercial perpendicular recording drive. Perpendicular recording has been in the works for a long time. In fact, when I used to examine patent applications for a living, there was patent literature related to perpendicular recording all the way back in 1990-1991, albeit for relatively simple aspects of the device.Gary Key - Tuesday, March 20, 2007 - link
The averaging of the time periods does work out to a doubling of capacities every 18~20 months but the last doubling took about 26 months to go from 250GB to 500GB.
mino - Wednesday, March 21, 2007 - link
Yes, but first 250GB drives were 4-platter 5400rpm ones(Maxtor?)...First 500GB were 5-platter 7200rpm ones.
IMO there are little dicrepancies in the tren dcaused bu the worry of many-platter drives after 75GXP. Aftre a few years Hitachi came back with 7K400 and the curve just returned to values it lost before...
scott967 - Tuesday, March 20, 2007 - link
On these big drives is NTFS performance an issue at all?scott s.
.
AbRASiON - Monday, March 19, 2007 - link
Too slow, too much money, too little space.I've owned 3 and sold them.
When are we going to see a 15krpm Savvio 2.5" review?
When will we see a 180gb per platter 32mb 10,000rpm new series raptor?
Maybe WD should also make a 15krpm 2.5" - 32mb model
These incrimental speed upgrades on hard disks are terrible :( need more, much much more.