Corsair Dominator PC2-10000: Fastest DDR2
by Wesley Fink on January 31, 2007 2:00 AM EST- Posted in
- Memory
Memory Bandwidth Scaling
Memory bandwidth normally improves with increases in memory speed and reductions in memory timings. This is best illustrated using Performance Scaling charts.
Since results for high-end memory were so close at all tested speeds, the scale range was reduced to better show the small differences in these memory benchmark results. Please keep this in mind when viewing the charts, since a normal zero scale would make performance differences appear much smaller than these expanded scale charts. Test values for memory at each speed are included below each chart for reference.
To evaluate memory bandwidth SiSoft Sandra 2007 Professional was used to evaluate standard Buffered performance and Unbuffered memory bandwidth.
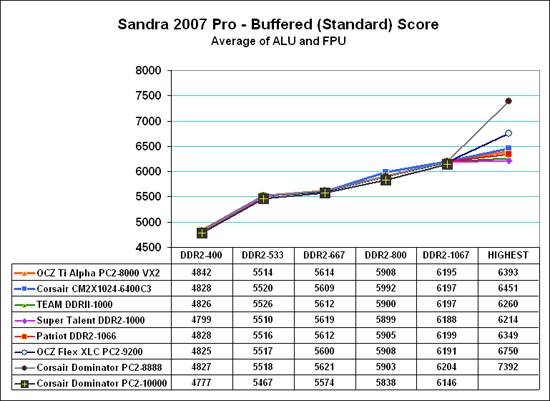
The most widely reported Sandra score is the Standard or Buffered memory score. This benchmark takes into account the buffering schemes like MMX, SSE, SSE2, SSE3, and other buffering tools that are used to improve memory performance. The Buffered benchmark does not correlate well with real performance differences in games, so our memory bandwidth tests have always included an Unbuffered Sandra memory score. The Unbuffered result turns off the buffering schemes, and we have found the difference in Unbuffered results correlate well with real-world performance differences.
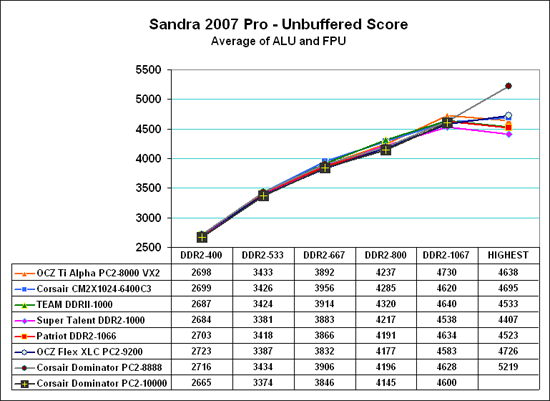
In both Buffered and Unbuffered tests Corsair Dominator 10000 performance curves compare to the best tested to the top tested speed of DDR2-1066 on the ASUS 975X based motherboard. Dominator 10000 requires slightly slower timings at DDR2-1066 than the top OCC Flex and Dominator PC2-8888. This translates into bandwidth that is lower than the other top memories at this speed. While the differences are extremely small, and don't show well in the charts, both Standard and Unbuffered bandwidth is at the low end of tested memory at all speeds. This high-speed memory is binned for top speed and not low latency, and you can see that reflected in slightly lower bandwidth in test results.
Performance with Version 1.5 of Super Pi was also compared. The Super Pi test compared the time to calculate 2 million places of Pi at the different memory speeds. This benchmark measures pure number crunching.
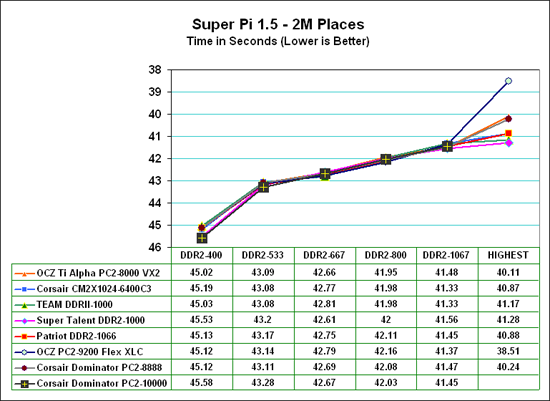
Super Pi results continue to improve to the highest speed that could be reached with stability with Corsair Dominator 10000 and other tested memories. What also stands out is how close the results with all the memories really are from DDR2-400 to DDR2-1066.. This is mainly a reflection of the fact that the compared memories are based on the same base Micron memory chips.
Memory bandwidth normally improves with increases in memory speed and reductions in memory timings. This is best illustrated using Performance Scaling charts.
Since results for high-end memory were so close at all tested speeds, the scale range was reduced to better show the small differences in these memory benchmark results. Please keep this in mind when viewing the charts, since a normal zero scale would make performance differences appear much smaller than these expanded scale charts. Test values for memory at each speed are included below each chart for reference.
To evaluate memory bandwidth SiSoft Sandra 2007 Professional was used to evaluate standard Buffered performance and Unbuffered memory bandwidth.
The most widely reported Sandra score is the Standard or Buffered memory score. This benchmark takes into account the buffering schemes like MMX, SSE, SSE2, SSE3, and other buffering tools that are used to improve memory performance. The Buffered benchmark does not correlate well with real performance differences in games, so our memory bandwidth tests have always included an Unbuffered Sandra memory score. The Unbuffered result turns off the buffering schemes, and we have found the difference in Unbuffered results correlate well with real-world performance differences.
In both Buffered and Unbuffered tests Corsair Dominator 10000 performance curves compare to the best tested to the top tested speed of DDR2-1066 on the ASUS 975X based motherboard. Dominator 10000 requires slightly slower timings at DDR2-1066 than the top OCC Flex and Dominator PC2-8888. This translates into bandwidth that is lower than the other top memories at this speed. While the differences are extremely small, and don't show well in the charts, both Standard and Unbuffered bandwidth is at the low end of tested memory at all speeds. This high-speed memory is binned for top speed and not low latency, and you can see that reflected in slightly lower bandwidth in test results.
Performance with Version 1.5 of Super Pi was also compared. The Super Pi test compared the time to calculate 2 million places of Pi at the different memory speeds. This benchmark measures pure number crunching.
Super Pi results continue to improve to the highest speed that could be reached with stability with Corsair Dominator 10000 and other tested memories. What also stands out is how close the results with all the memories really are from DDR2-400 to DDR2-1066.. This is mainly a reflection of the fact that the compared memories are based on the same base Micron memory chips.


22 Comments
View All Comments
pnyffeler - Wednesday, January 31, 2007 - link
That's crazy! I completely understand that everybody wants the best and the fastest, but this is getting absurd. With that kind of money, you could buy a new graphics card or even a faster processor, which would have so much more of an impact on gaming speed or whatever you might be running. Any doubts people might have about this can be solved by looking at the spread of those speed charts. The difference in performance in games is probably about as much as leaving Outlook open while you play Far Cry.RobFDB - Wednesday, January 31, 2007 - link
$915 give or take here in the UK. Lovely...