The NVIDIA GeForce 7900 GS: A Closer Look
by Josh Venning on September 19, 2006 5:00 AM EST- Posted in
- GPUs
Power
Power draw is also an important factor when evaluating a graphics solution. For a card that performs or overclocks well, it can be a big drawback if the card draws a lot of extra power, especially for those running SLI setups. We test power by measuring the total wattage of the system with each card installed in two different states. The first state is while the system is idle, without any programs running, and the second state is under load, by running a graphically intensive benchmark. The benchmark we used to stress the graphics cards was 3DMark06, specifically, the fill rate (single and multi-texturing) and the pixel shader tests.
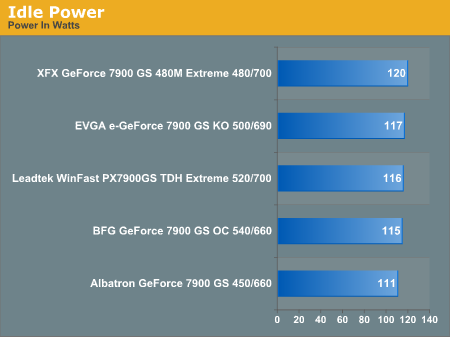
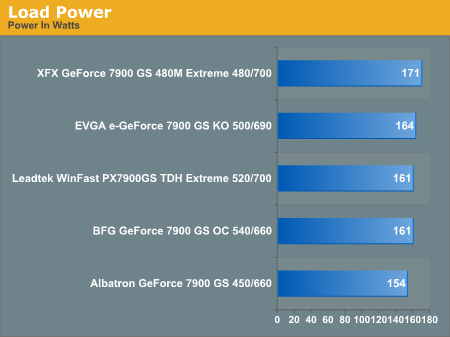
The first thing we notice here is that the XFX GeForce 7900 GS RoHS Extreme is the most power-hungry card while the system is both idle and under load. Under load, the difference is more pronounced, and the system draws about seven more watts than the card with the second highest power draw. This could be a bit of a problem for those interested in overclocking it themselves. A card with this kind of power draw will most likely get hotter and put more of a strain on your power supply while being overclocked. Conversely, the Albatron 7900 GS draws the least amount of power at both states, which makes sense considering its low clock speeds.
What is a little strange and could be seen as a plus for this card, is that the BFG 7900 GS OC, our highest-clocked 7900 GS, got the second lowest score in our power tests at both idle and load states. However, it was almost exactly tied with the Leadtek WinFast PX7900 GS TDH Extreme, which was our second-highest factory clock card. This is a bonus for both of these cards.
Heat
Similar to the way we tested power consumption, we measured the heat level of the cards in two different states: idle and after five minutes of stress testing. In order to stress test the card, we made use of ATI Tool's "Scan for Artifacts" function on their "fuzzy cube" 3D view. This feature basically works by drawing a 3D cube with some kind of fuzz map over and over and about five minutes of "scanning" with this tool gives us the same kind of heat reading we typically get from a period of extended gameplay.
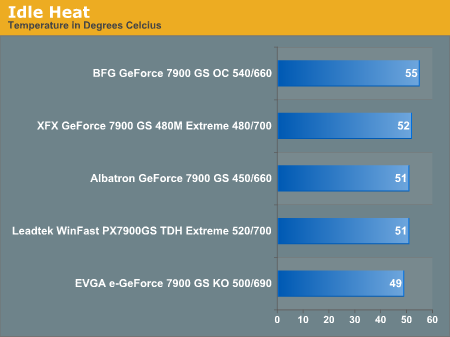
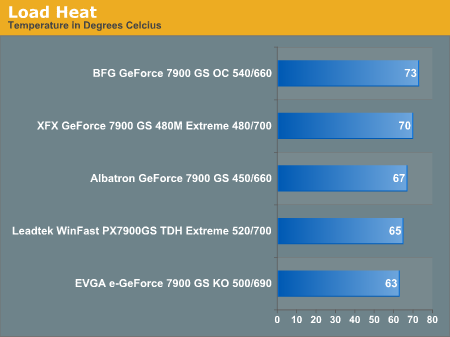
Here we see that the factory overclocked BFG GeForce 7900 GS OC generates the most heat of the five, which isn't too surprising given its level of performance. Interestingly, there doesn't seem to be much correlation between power loads and heat levels for these cards, as our numbers show. The coolest-running 7900 GS we have is the EVGA e-GeForce 7900 GS KO, which might make it the 7900 GS of choice for those concerned about heat levels because of their climate or case circulation. Something notable here is that the Leadtek PX9700 GS TDH Extreme gets a fairly low heat score in our tests in spite of having one of the higher factory overclocks.
Lower temperatures can also mean better overclocking potential, which may explain the higher overclock we got with the EVGA card. Overclockers also know that adding more voltage can improve stability when overclocking - whether it be for CPUs, GPUs, or memory - and that might explain the higher power draw of the XFX card.
Power draw is also an important factor when evaluating a graphics solution. For a card that performs or overclocks well, it can be a big drawback if the card draws a lot of extra power, especially for those running SLI setups. We test power by measuring the total wattage of the system with each card installed in two different states. The first state is while the system is idle, without any programs running, and the second state is under load, by running a graphically intensive benchmark. The benchmark we used to stress the graphics cards was 3DMark06, specifically, the fill rate (single and multi-texturing) and the pixel shader tests.
The first thing we notice here is that the XFX GeForce 7900 GS RoHS Extreme is the most power-hungry card while the system is both idle and under load. Under load, the difference is more pronounced, and the system draws about seven more watts than the card with the second highest power draw. This could be a bit of a problem for those interested in overclocking it themselves. A card with this kind of power draw will most likely get hotter and put more of a strain on your power supply while being overclocked. Conversely, the Albatron 7900 GS draws the least amount of power at both states, which makes sense considering its low clock speeds.
What is a little strange and could be seen as a plus for this card, is that the BFG 7900 GS OC, our highest-clocked 7900 GS, got the second lowest score in our power tests at both idle and load states. However, it was almost exactly tied with the Leadtek WinFast PX7900 GS TDH Extreme, which was our second-highest factory clock card. This is a bonus for both of these cards.
Heat
Similar to the way we tested power consumption, we measured the heat level of the cards in two different states: idle and after five minutes of stress testing. In order to stress test the card, we made use of ATI Tool's "Scan for Artifacts" function on their "fuzzy cube" 3D view. This feature basically works by drawing a 3D cube with some kind of fuzz map over and over and about five minutes of "scanning" with this tool gives us the same kind of heat reading we typically get from a period of extended gameplay.
Here we see that the factory overclocked BFG GeForce 7900 GS OC generates the most heat of the five, which isn't too surprising given its level of performance. Interestingly, there doesn't seem to be much correlation between power loads and heat levels for these cards, as our numbers show. The coolest-running 7900 GS we have is the EVGA e-GeForce 7900 GS KO, which might make it the 7900 GS of choice for those concerned about heat levels because of their climate or case circulation. Something notable here is that the Leadtek PX9700 GS TDH Extreme gets a fairly low heat score in our tests in spite of having one of the higher factory overclocks.
Lower temperatures can also mean better overclocking potential, which may explain the higher overclock we got with the EVGA card. Overclockers also know that adding more voltage can improve stability when overclocking - whether it be for CPUs, GPUs, or memory - and that might explain the higher power draw of the XFX card.


42 Comments
View All Comments
sum1 - Wednesday, September 20, 2006 - link
Let me clarify:
"The BFG 7900 GS OC's core clock is set at 520MHz, a 70MHz increase over the standard NVIDIA 7900 GS"
It’s listed at 540MHz everywhere else in this article (including the benchmarks).
DerekWilson - Tuesday, September 19, 2006 - link
For some reason, BFG's website lists it as 525MHz. We'll double check our sample, but we listed the speed of the card we reviewed.http://www.bfgtech.com/7900GS_256_PCIX.html">http://www.bfgtech.com/7900GS_256_PCIX.html
EVGA is actually EVGA despite the fact that people tend to lowercase the leading 'e'. Check their own press releases on their site.
http://www.evga.com/about/pressrelease/default.asp...">http://www.evga.com/about/pressrelease/...t.asp?re...
Maybe uniqueness can come in shades of blue if it can't be grey :-) I see your point, but sometimes taking a little liberty with language gives us the ability to succinctly convey something like the idea that "this is mostly the same as everything else with a slight difference in one area".
yacoub - Tuesday, September 19, 2006 - link
I really don't like the line graphs... very hard to read when more than three or four lines are close together. Get much more meaningful data much more quickly from traditional bar graphs or a simple table with numbers.DerekWilson - Tuesday, September 19, 2006 - link
the line graphs include a table -- just ignore the top part :-)the problem with bar graphs are that they don't clearly show trends between cards over different resolutions, they don't show the impact of increasing resolution for each card, and they take up qutie a bit more space.
we'd love to hear more good suggestions on ways we can better present our data though.
Questar - Tuesday, September 19, 2006 - link
Stacked bars do.
DerekWilson - Tuesday, September 19, 2006 - link
i think those are harder to read than line graphs.VooDooAddict - Tuesday, September 19, 2006 - link
I agree that they are harder to read. Persoanlly I like the way they show how the cards scale. Unfortunetly while it's nice to have all the data right there. I used to be able to show non-techie friends a page or two from your review to pointout the performance advantages of one video chipset over the other.With the new line graphs and data grids I need to make my own simple bar graphs from your data to show friends info relivant to thier purchase decision. (I would never re-publish these graphs with your data... just used to give non-techie friends better direction.)
As a side note. I personally know quite a few people out there debating over the current $100-$240 range: The new X1300 XT (Which is baqsicly a X1600 Pro), X1600 XT, 7600GS, 7600GT, X1900GT, 7900GS, 7900GT (with rebates) ... you might want to take note of these if you ever toss up more Low-Midrange buying guides.
yacoub - Tuesday, September 19, 2006 - link
"The EVGA 7900 GS's heat sink is slightly longer than the reference 7900 GS's heat sink and it has two gill-shaped cutouts exposing some copper ridges from the inside of the sink. Aside from that, the card has the signature EVGA black coloring, with their logo and card name in clear view on the face."You could also mention that it covers the RAM chips. That's kind of the point of its design and something nice to have.
Kougar - Tuesday, September 19, 2006 - link
Finally happy to see that eVGA only cooler get tested, looks like they knew what they were doing desiging it and using it on many of their G70 cards...Should also note the eVGA has had a $20 MIR on it for over a week, ties it with the XFX for best priced... but the warranty, non-stock cooler, and HDCP support ought to make it an obvious choice between the two.
mostlyprudent - Tuesday, September 19, 2006 - link
XFX makes a passively cooled 7950GT, but puts a fan on their 7900GS? Maybe it's a price issue (more expensive to passively cool a card and less profit margin at the $200 price range)?