Intel Woodcrest, AMD's Opteron and Sun's UltraSparc T1: Server CPU Shoot-out
by Johan De Gelas on June 7, 2006 12:00 PM EST- Posted in
- IT Computing
MySQL Configuration
We spent weeks on tweaking our MySQL database to the maximum. The results were encouraging: performance was up to 3 times higher on our Opteron machines than out of the box. On the Sun machine, the results were even more impressive, especially when we started using MySQL 5.0. MySQL 5 runs horribly slow on the T1 out of the box, but we got up to 5 times more performance out of our T2000 server after getting some excellent tweaking tips from Peter Zaitsev (MySQL) and Luojia Chen (Sun).
All testing was done with InnoDB as our storage engine in MySQL 5.0.21. We optimized for a server with 4 GB of RAM. Here is our MySQL configuration:
The "query cache" was off, as we wanted to test worst case performance. Our test database is still the same as in previous articles, about 1GB in size. The workload consists of more than 90% selects, thus this is mostly a "read intensive" workload.
MySQL Results
All numbers are expressed in queries per second.
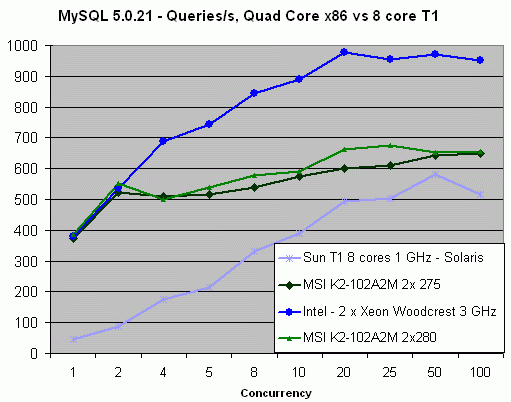
Notice that the T1 needs about 20-30 MySQL threads to run at full speed; this is clearly a result of it's 8 core "4 thread Gatling gun core" architecture. It must also be noted that the out-of-the box MySQL performance is simply horrible, about 4-5 times lower than the well optimized numbers you see above. There is no escaping the face that you must take the time to read Sun's tunings tips well.
Once you do, the 1 GHz T1 is capable of performing like an Opteron 2.2 GHz, which is pretty amazing. Kudos to Luojia Chen and Peter Zaitsev for a job well done. While the old Xeon which consumed 4 times more power than the T1 to give the same performance looked pretty silly, the new Xeon 5160 easily outperforms the T1. The performance/Watt title will probably go to the low power Woodcrest versions, which we haven't tested yet.
Let us see what a single dual-core Woodcrest can do versus a dual-core Opteron and quad-core Sun T1.
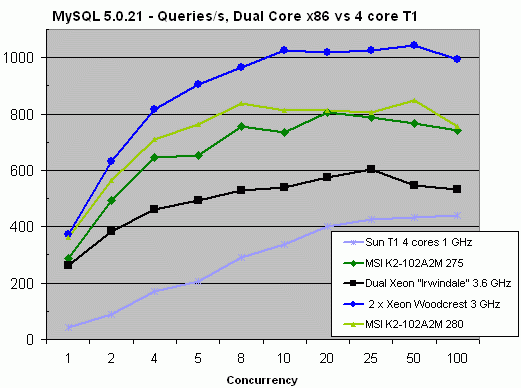
As we were testing with only two cores, we brought back the Dual Xeon Irwindale for the test. We did a few extra tests on this platform as we also had the older Nocona platform in the labs. The additional 1MB cache of Irwindale improved our benchmark numbers by 7-8%, which is quite impressive. Our time investment in tweaking our MySQL database also made the caches and memory system more important. Finally, Hyper-Threading still doesn't pay off in MySQL: we noticed a small slowdown of about 7%.
We spent weeks on tweaking our MySQL database to the maximum. The results were encouraging: performance was up to 3 times higher on our Opteron machines than out of the box. On the Sun machine, the results were even more impressive, especially when we started using MySQL 5.0. MySQL 5 runs horribly slow on the T1 out of the box, but we got up to 5 times more performance out of our T2000 server after getting some excellent tweaking tips from Peter Zaitsev (MySQL) and Luojia Chen (Sun).
All testing was done with InnoDB as our storage engine in MySQL 5.0.21. We optimized for a server with 4 GB of RAM. Here is our MySQL configuration:
[mysqld]

port3306

socket= /tmp/mysql.sock

skip-locking

key_buffer = 1G

max_allowed_packet = 1M

table_cache = 1024

sort_buffer_size = 2M

read_buffer_size = 2M

read_rnd_buffer_size = 8M

thread_cache = 125

max_user_connections = 450

max_connections = 450

thread_concurrency = 16
The "query cache" was off, as we wanted to test worst case performance. Our test database is still the same as in previous articles, about 1GB in size. The workload consists of more than 90% selects, thus this is mostly a "read intensive" workload.
MySQL Results
All numbers are expressed in queries per second.
Notice that the T1 needs about 20-30 MySQL threads to run at full speed; this is clearly a result of it's 8 core "4 thread Gatling gun core" architecture. It must also be noted that the out-of-the box MySQL performance is simply horrible, about 4-5 times lower than the well optimized numbers you see above. There is no escaping the face that you must take the time to read Sun's tunings tips well.
Once you do, the 1 GHz T1 is capable of performing like an Opteron 2.2 GHz, which is pretty amazing. Kudos to Luojia Chen and Peter Zaitsev for a job well done. While the old Xeon which consumed 4 times more power than the T1 to give the same performance looked pretty silly, the new Xeon 5160 easily outperforms the T1. The performance/Watt title will probably go to the low power Woodcrest versions, which we haven't tested yet.
Let us see what a single dual-core Woodcrest can do versus a dual-core Opteron and quad-core Sun T1.
As we were testing with only two cores, we brought back the Dual Xeon Irwindale for the test. We did a few extra tests on this platform as we also had the older Nocona platform in the labs. The additional 1MB cache of Irwindale improved our benchmark numbers by 7-8%, which is quite impressive. Our time investment in tweaking our MySQL database also made the caches and memory system more important. Finally, Hyper-Threading still doesn't pay off in MySQL: we noticed a small slowdown of about 7%.


91 Comments
View All Comments
rayl - Thursday, June 8, 2006 - link
"Best Performance/Watt in the high end "Which part of performance per watt do you not understand? Do more, pay less.
MrKaz - Thursday, June 8, 2006 - link
Dual Opteron 275 HE 2CPU's (275HE) - 4 GB RAM 192 Watts!!!Dual Opteron 275 2CPU's - 4 GB RAM 239 Watts!!!
Dual Xeon 5160 3 GHz 2 CPU's - 4 GB RAM 245 Watts!!!
http://www.intel.com/performance/server/xeon/ppw.h...">http://www.intel.com/performance/server/xeon/ppw.h...
Even Intel numbers show Xeon 3.6Ghz on par with AMD (obvious fake)
And the do more pay less, is not like you say on the server market, while your PC is doing lot of work (processing) with a computer game, most servers stand there doing almost nothing. Our servers for example from 0:00 to 8:00 do almost zero. Even in the day they work very little. Our Xeon 2.4 is more than enough, and I think most people think the same. Of course this depends a lot what you do, but this is generic. I think you know why virtualization is very important right?
rayl - Thursday, June 8, 2006 - link
Isn't this obvious to you. Those are power consumption numbers at 100% CPU load. This is where performance/watt number really matters.If you're running idle, the power saving mode starts kicking in, you'll need a separate table to draw your conclusion.
Why this preoccupation with power consumption? 6-watts for a performance leap; it's moot.
coldpower27 - Thursday, June 8, 2006 - link
It will be interesting to note the Delta difference between 1 Woodcrest 5160 and 2 is 59W as reported by TechReport, and since the TDP for Woodcrest 5160 is 80W TDP we can extrapolate and since the TDP for Woodcrest 5148 is 40W I can expect it to spew about 30W per processor.
245W - (2x29W) = 187W
This bring the Low Power Woodcrest system to ~ the same power usage as the HE Opteron 275's even with the heat spewing FB-DIMM's with higher performance per watt, pretty impressive.
Questar - Thursday, June 8, 2006 - link
Yeah I'm worried about those six watts of power when I'm getting twice the performace.fikimiki - Thursday, June 8, 2006 - link
You forgot about Intel chipset consumption - 22 Watts.So Intel has 245+22=267 vs. 192 and even if you are running in power-saving mode, chipset is running all the time...
coldpower27 - Thursday, June 8, 2006 - link
No Wrong, they measured the system power consumption hence why the Woodcrests systems are so hungry in comparison to the Opteron the FB-DIMM's are what eating away at the wattage.So in the end it's 223 + 22 = 245, if indeed the chipset is consuming 22W.
Questar - Thursday, June 8, 2006 - link
That was system power consumption - it included the chipset dufus.Saist - Wednesday, June 7, 2006 - link
I amd going to make the argument that evaluating only one version of Linux in this type of situation is not a good idea in and of itself. Not to knock Gentoo directly, it is a fine distro to itself, but it has a very small slice of the Linux market. It would have made more sense for Anandtech to have benchmarked using other distrobution types for a couple of reasons.The first reason is the ability to duplicate the tests. This is actually a strike against Gentoo for what the operating system is. While it possible to duplicate an installation of Gentoo and the applications used, generating an exact copy of the exact configuration used without clear description of the compile targets used is very hard. This means that anybody wishing to reproduce these results on their own will be very hard-pressed to do so.
The second reason is commercial and residential use. Gentoo has it's market, that market just isn't very widespread. It would have made more sense for Anandtech to have tested a RPM based distro such as Mandriva, RedHat, Fedora Core, Novell Suse, or OpenSuse against a .deb based distro such as Debian(sid), Ubuntu, Mepis, or Xandros. The reason why it would have made more sense is that .deb and .rpm distros are actually used in the commercial and residential spheres, and used in great quantities. Had Anandtech used a distrobution that is in active use it would mean more to buyers currently looking to replace their Windows computers with a new system.
It would only be in the interests in providing a point of perspective that one would test a different type of Linux distrobution like Gentoo or Slackware.
Going back to the first point, had Anandtech benchmarked these on a Debian based system it would be fairly easy to duplicate the tests. Anandtech would just need to list the base version of the Debian distro they used, list the apt-repositories they pulled from, and the application in apt that were pulled. Anybody else who comes along afterwords with a Debian based distro would easily be able to duplicate the steps and the benchmarks.
The overall point is that while it is nice to see a non-dedicated Linux site approaching hardware, this isn't the way to approach it. As it stands now, the Anandtech tests are useless, reguardless of whatever results the benchmarks returned.
BasMSI - Thursday, June 8, 2006 - link
These tests are also 100% useless.....The MSI K2-102 is numa aware....
But for some reason the K8N-Master isn't shown in the graphs....that board is NOT NUMA aware.
I'm also missing the HP server everywhere in the graphs.
I realy believe all these tests are done on the K8N-Master board for all Opteron tests.
No way the graphs are showing all the systems.
These tests are a total fraude, letting us believe Intel all of a sudden became that fast.
No way on earth I believe any of these results.
Also, why using Gentoo? Why not Debian 64bit?
This puzzles me, as Gentoo is compiled but not known to be faster on every system.
Why not using precompiled Linuxes? Like Debian 64bit....that one is stable as hell and incredible fast!
Too much parameters missing here to get any judgement at all.
Do it better, this is 100% rubbish.
Bas.