Seagate Barracuda 7200.10 750GB: Size Does Matter
by Gary Key on May 18, 2006 9:00 AM EST- Posted in
- Storage
IPEAK Business Application Tests
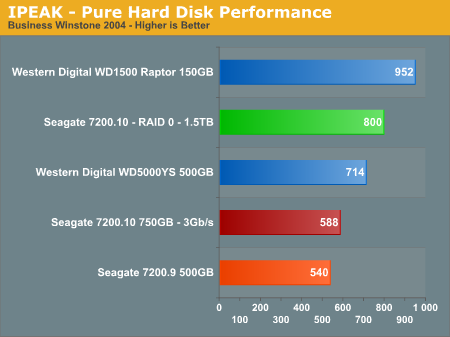
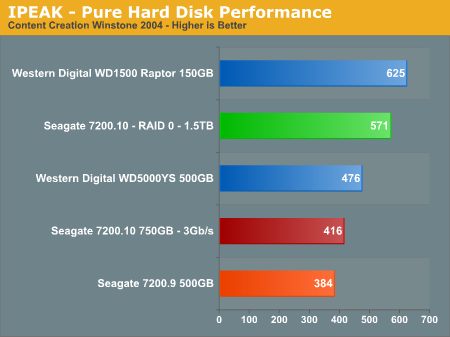
Our IPEAK Winstones benchmarks offer a glimpse into how well our hard disk drives will handle general office applications, media encoding, and graphics manipulation. While the business applications that are being tested tend to be more CPU bound at times, the performance of the hard drive can and will make a difference in the more disk intensive video and graphics applications where large media files are typically being edited.
As expected, the WD Raptor places first as its 10k RPM spindle speed and optimized cache play an important role in its ability to sustain high transfer rates, especially in the Content Creation benchmark where transfer block sizes are significantly larger than in the Business application benchmark.
The Seagate 7200.10 outperforms the 7200.9 by 9% in the Business test and 8% in the Media Content test. These scores are consistent with Seagate's claims that the 7200.10 should outperform the 7200.9 by 10% on average. The WD RE2 500GB drive makes a very strong showing in these benchmarks; obviously it continues the performance trend set by the WD RE2 400GB product. The RAID 0 performance of the Seagate 7200.10 is very good with drive performance increases of 36% in the Business test and 37% in the Content Creation test but still not enough to match the WD Raptor.
IPEAK General Task Tests
The IPEAK based General Task benchmarks are designed to replicate utility based application tasks that typically are disk intensive and represent common programs utilized on the majority of personal computers. While the WinRAR program is very CPU intensive it will typically stress the storage system in short bursts. Our antivirus benchmark will stress the storage system with continual reads and sporadic write requests while the defragmentation process is split between continual read and write requests.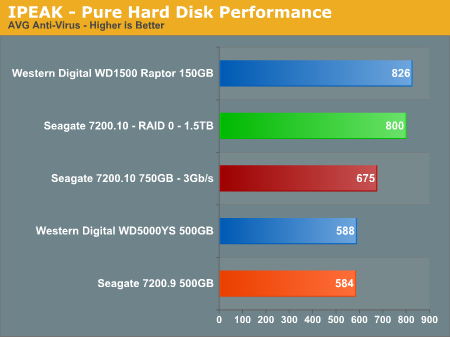
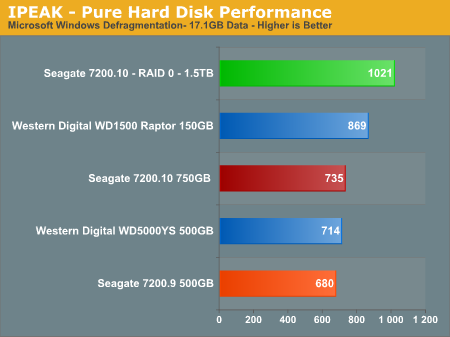
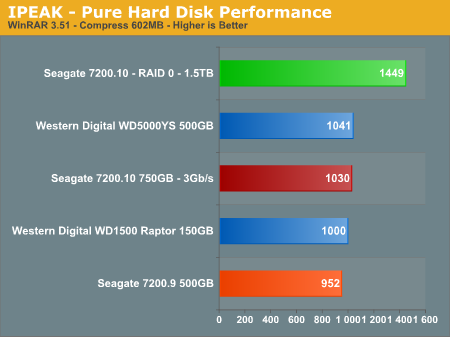
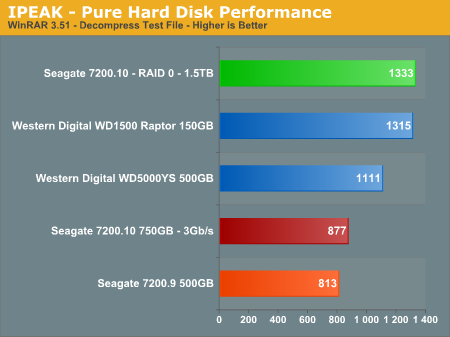
The Seagate 7200.10 RAID 0 combination scores first in three of the four tests with the WD Raptor close behind while the Raptor takes three of four tests in the single drive category. The Barracuda 7200.10 finally surpasses the WD RE2 and posts excellent scores in the very drive intensive antivirus and disk defragmentation benchmarks but falls up to 26% behind in the file decompression test. The Seagate 7200.10 outperforms the 7200.9 by 8% in the WinRAR tests, 8% in the defragmentation test, and 15% in the AVG antivirus benchmark that continues a steady pattern of improved performance for this series.


44 Comments
View All Comments
JakeBlade - Friday, May 26, 2006 - link
Interesting that this drive has a MADE IN SINGAPORE label instead of Seagate's usual MADE IN CHINA junk.ElFenix - Friday, May 19, 2006 - link
no reason to upgrade from my SE16, i see.i'd like to see a couple more drives in tests, such as the latest hitachi.
Gary Key - Friday, May 19, 2006 - link
The reason we did not include the Hitachi unit is we have the revised 500GB unit arriving shortly and as mentioned in the article we will have a complete 500GB roundup with the new 7200.10 also. It will take some time to build the database with the revised test suite as we also have additional application timer tests coming shortly.
The performance across most of the recently released mainstream drives is so close now that it comes down to a personal decision on warranty, reliability, thermals/acoustics, and capacity for the most part. However, drives like the Raptor and RE2 series do make things interesting for SATA on the desktop as did this drive for a PVR fanatic. ;-)
ElFenix - Friday, May 19, 2006 - link
i'd also like to see audio tests from a little bit further away. 5 mm doesn't give a realistic idea of how loud it will be sitting 3 feet away on the floor. plus, for all i know where you place the microphone is extremely important when at 5 mm.Gary Key - Friday, May 19, 2006 - link
There is no one good area to measure the acoustics as you never know where the PC will be located, what type of case, fan noise, or ambient sounds are present. I can tell you that a drive that is loud at 3mm~5mm will be loud at three feet with all things being equal. Sound tones are also very subjective, the dull thumping sound the drive has under load might be perfectly acceptable while the higher pitched clicking sound of a Maxtor will be unbearable for some people.
We place the two mics at different points on the drive to ensure a consistent recording point, we assume most people will utilize a horizontal mounting point with the rear of the drive facing the case front, although we test the drive facing the case side also as this cage design is becoming very popular. The tone of the drive can change dramatically with the addition of rubber washers between the drive and the mount points.
Thanks for the comments. :)
jhvtoor - Friday, May 19, 2006 - link
Temperature measurement using S.M.A.R.T. is not reliable. The sensor and electronics on the harddrive are used, en they are not calibrated.
I am using the freeware "HDD Health" utility to monitor the SMART information. It reported the drive temperature of my desktop is 12 degrees celcius immediatly after winXP boot, while the room temperature is 19 degrees.... I am not using cooling techniques on this drive. This can only be explained by an inaccurate temperature measurement of this drive.
I would suggest to use one an independent measurement instument in the future. Attach the sensor in the middle of the cover plate.
Gary Key - Friday, May 19, 2006 - link
Hi,1. We have found S.M.A.R.T. to be "fairly" accurate along with our capture utility. We know it is not perfect but it allows us a consistent measurement of each drive in testing. In our 7200.10 test ActiveSmart reported a temperature of 26c after boot, room temp was 22c. We put the drive through 15 minutes of light usage, let it idle for 15 minutes, and then report this number as our idle number. All of the drives we have tested have followed the same pattern with a consistent idle reading after this usage, the idle temp will be the same 15 or 30 minutes later. If you stress the drive, you will see the temps rise accordingly and then fall back to the standing idle temp during the cooldown phase.
2. One drawback is the temperatures are not "real" time, there is a delay built in, this is why on the load test (also idle) we loop PCMark05 several times and then take the reported temperature at the end of the session, generally the high temperature was actually reached in the previous loop.
3. We have have tried using a sensor, infrared, and other methods with varying results. The problem is each section of the drive will report a different number. When we utilized a sensor on the top plate, the temps varied from drive to drive with the same model being tested. Each supplier uses different materials for their casings so that creates greater variables, it just is not consistent enough to report.
toattett - Thursday, May 18, 2006 - link
Apparently,If I want a speedy drive, I buy the raptor.
If I want a super large drive, I buy the new 750GB Seagate.
If I want good performance and good amount of stoarge, I buy the 500GB WD.
Missing Ghost - Thursday, May 18, 2006 - link
The pictures for the noise level are wrong. You put the dbA level as if it was a linear scale. It's not that way, the space between 0dB and 10dB should be smaller than the space between 10dB and 20dB. That way it will show more clearly the difference between the noise levels. It's a logarithmic scale.Gary Key - Thursday, May 18, 2006 - link
Our current graph engine will not allow us to do this type of scale manipulation. We will probably have to utilize a Microsoft Excel chart in the next article. We agree with you, just not possible with the internal engine at this time although we are working on a new one.